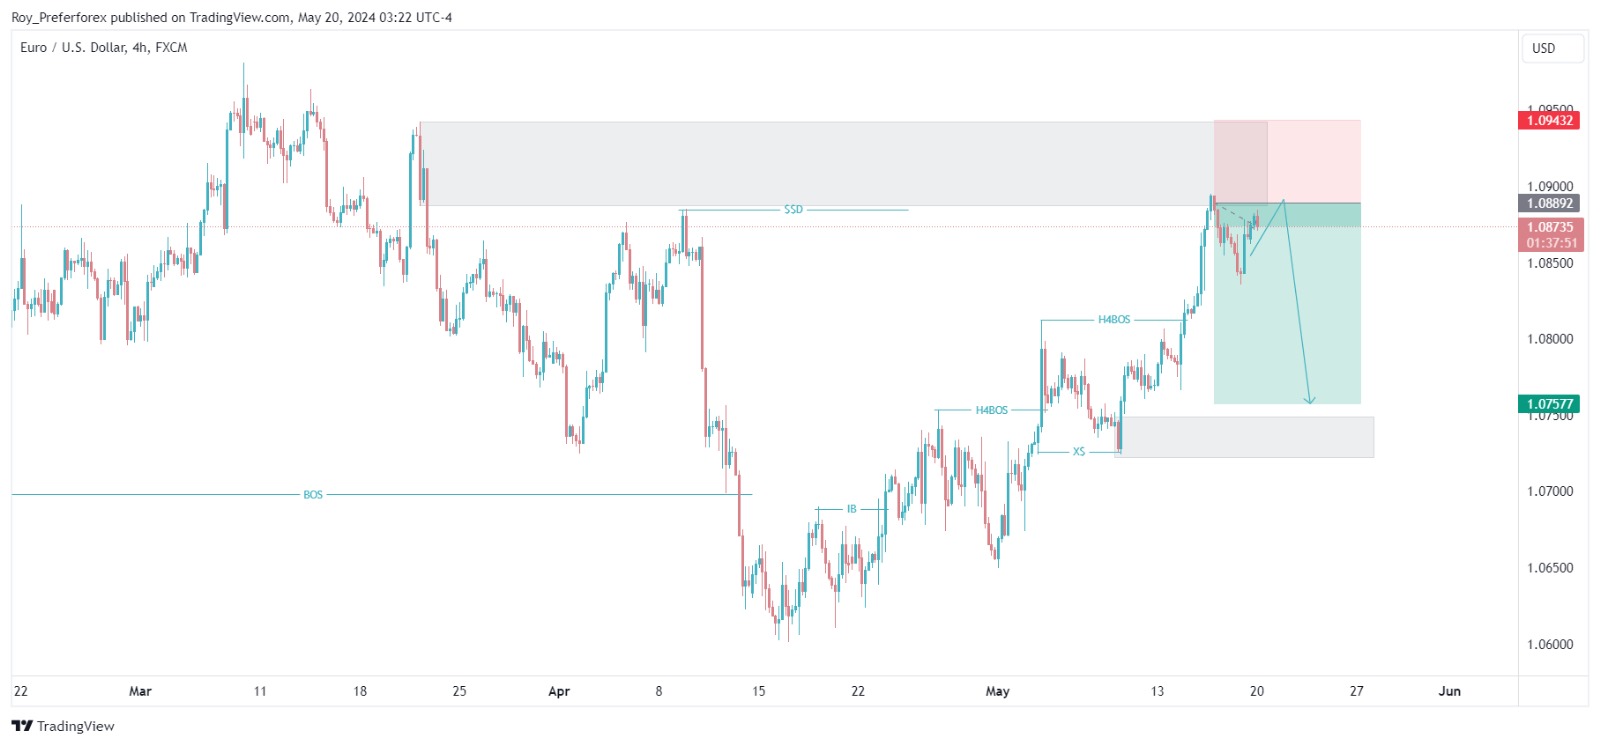
According to the daily chart, the price is currently following a bearish structure. The most recent break of structure happened at 1.0700 level. The recent bullish movement is the retracement movement, which takes out the inducement liquidity and then begins to react.
On the 4-hour chart, we can see the price is moving upwards by following the bullish market structure. Now it is reacting on a POI. Since the market structure is bearish on the daily time frame, we can anticipate a bearish movement from this POI targeting the short-term POIs marked on the chart. If the price reacts from those short-term POI, then we may see another swing high, but if the price breaks the recent short-term swing low, then we can expect further bearish movement targeting the low of the chart. Please watch the video for detailed insight This top-down analysis is based on the smart money and price action concept. To learn the actual smart money concept trading and how to identify high-potential and low-risk entry points, You can enroll in our course, which is completely free to sign up for. Join The FREE course
USDCAD is still respecting yesterday’s bearish failed auction view. Price is reacting near the 4H reaction zone, and a break below short-term demand can open downside targets.
USDCAD is accumulating near a key 4H demand zone after a possible failed auction. Roy’s analysis focuses on whether price can close below demand and open a bearish move toward lower liquidity.
AUDUSD is trading near a bullish point of interest after sweeping short-term liquidity. If price holds the demand zone and confirms bullish order flow, the next focus stays on upside liquidity targets.
EURUSD remains under short-term bearish pressure after breaking 4H structure, but price is moving toward key bullish POI zones. This weekly analysis reviews the main liquidity areas, demand levels, bullish confirmation plan, invalidation level, and the Fed-related catalyst that can guide the next move.
EUR/USD is trading near a key bullish POI after sweeping internal sell-side liquidity, but USD strength keeps pressure on the pair. Read the full breakdown to see the demand zone, confirmation plan, upside targets, and invalidation level
The GBP/USD currency pair has rebounded from its lowest point in seven months, which was at $1.2038. As a result, the pair has surpassed its downtrend channel resistance line at $1.2178, and it is now approaching last week’s high of $1.2271
GBPUSD Price Action
The main trend of GBP/USD is currently bullish. However, you believe that the currency pair is currently in a retracement phase and will soon approach a support zone that you have indicated in a video. You anticipate that once the pair reaches this support zone, it will begin to decline again, particularly during the release of the Non-Farm Payroll (NFP) report. It’s worth noting that NFP is a major economic indicator that can have a significant impact on the forex market, and traders often adjust their positions accordingly.
release.
This is our trading plan
Understanding the Current State
As of the latest market analysis, the GBP/USD currency pair has been on a bullish trend, indicating that the British pound (GBP) has been gaining strength against the US dollar (USD). This upward movement has been driven by various factors, including economic data, political developments, and market sentiment.
The Retracement Phase is Going on
Despite the prevailing bullish trend, experienced traders have noticed signs that the GBP/USD pair might be entering a retracement phase. A retracement is a temporary reversal in the direction of a prevailing trend. In this case, the retracement could mean a temporary decline in the GBP/USD exchange rate.
Traders have identified a specific support zone, which is an area on the price chart where they anticipate the pair may find buying interest. This support zone is crucial for understanding potential price movements in the near future. When the GBP/USD pair approaches this zone, it could either bounce back upwards or breakthrough, signaling a potential reversal.
The Role of the Non-Farm Payroll (NFP) Report
The Non-Farm Payroll (NFP) report is a key economic indicator released by the U.S. Bureau of Labor Statistics on the first Friday of each month. It provides crucial data about the employment situation in the United States, including the number of new jobs created, the unemployment rate, and wage growth. The NFP report is closely watched by traders and investors worldwide because of its potential to impact the forex market significantly.
During the release of the NFP report, market volatility tends to increase, and traders often adjust their positions in response to the data. If the NFP report reveals strong job growth and positive economic indicators, it can strengthen the U.S. dollar. Conversely, if the report disappoints, it can weaken the USD.
Anticipating the Impact
Traders are paying close attention to the upcoming NFP report because it could coincide with the GBP/USD pair approaching the previously mentioned support zone. If the NFP report surprises to the upside and boosts the USD, it may push the pair further down, potentially triggering the anticipated retracement.
Conclusion
In summary, the GBP/USD currency pair has been on a bullish trend, but experienced traders are cautious about a potential retracement phase. The upcoming release of the Non-Farm Payroll (NFP) report adds an extra layer of complexity to the market, as it can have a significant impact on the forex market’s direction.
Traders will closely monitor the GBP/USD pair as it approaches the support zone, and they will be especially attentive during the NFP report release. The combination of these factors may lead to heightened volatility and trading opportunities, making it an important period for forex traders to keep a close eye on their positions and strategies
Get our Institutional forex signals FREE trial. With every subscription, we provide a free risk management guide to enhance your trading quality. With every signal we provide clear stop loss and target, and depending on price action we send close notification if required to close early.
USDCAD is still respecting yesterday’s bearish failed auction view. Price is reacting near the 4H reaction zone, and a break below short-term demand can open downside targets.
USDCAD is accumulating near a key 4H demand zone after a possible failed auction. Roy’s analysis focuses on whether price can close below demand and open a bearish move toward lower liquidity.
AUDUSD is trading near a bullish point of interest after sweeping short-term liquidity. If price holds the demand zone and confirms bullish order flow, the next focus stays on upside liquidity targets.
EURUSD remains under short-term bearish pressure after breaking 4H structure, but price is moving toward key bullish POI zones. This weekly analysis reviews the main liquidity areas, demand levels, bullish confirmation plan, invalidation level, and the Fed-related catalyst that can guide the next move.
EUR/USD is trading near a key bullish POI after sweeping internal sell-side liquidity, but USD strength keeps pressure on the pair. Read the full breakdown to see the demand zone, confirmation plan, upside targets, and invalidation level
[/vc_column_text][vc_video link=”https://youtube.com/shorts/u90h9P-Xxhw” ratio=”9×16″][/vc_column][/vc_row][vc_row width=”full” height=”auto”][vc_column][us_cta title=”Are YOU Ready Start Profit Making?” btn_label=”FREE Trial” btn_link=”%7B%22url%22%3A%22https%3A%2F%2Fpreferforex.com%2Fforex-signals%2F%22%7D” btn_style=”8″]A limited number of Weekly FREE trial offers are given now every week – book your seat before close.[/us_cta][/vc_column][/vc_row]
Following the FOMC release this week, the EUR/USD pair fell to 1.0855, marking its lowest point since Friday. As the Asian session approaches, traders are getting ready to scrutinize the forthcoming US labor market data, and the pair has a bearish tone. In last week’s forecast, we predicted that the bearish movement would continue until the price reached the next two targets (as we showed in the chart). The market followed exactly the same pattern you can see that video link in the top right corner. Price hit those targets. However, the price reacted to the demand zone but we found that it failed to make any bullish structure and the price moved downward, It broke the recent low.
EURUSD Daily Time Frame
Based on this analysis, it appears that the market is currently experiencing a significant downward trend. The fact that it has broken the recent swing point on the left and is approaching the extreme demand zone suggests that there may be further downside potential. It will be important to monitor the market closely to see if it is able to find support at this level, or if it continues to move lower. Additionally, it may be beneficial to consider other time frames and technical indicators to gain a more comprehensive understanding of the market’s overall direction and potential future movements.
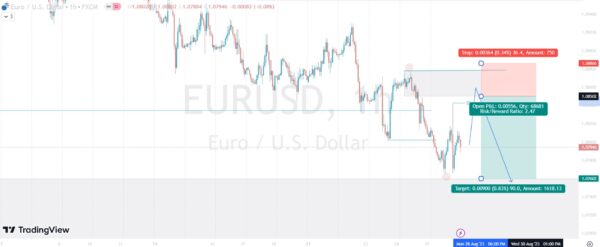
the 1h chart to see the microstructure of the pair. Here you can see the price breaks the last low and moving down. According to the microstructure, this is the recent swing high and this is the swing low. And This is the supply zone. this high can act as a liquidity zone. We are expecting the price will reach to this supply zone to test. After that, it may resume bearish till the next target. However according to the daily chart, the price is approaching the extreme demand zone, so to take a short position we have to wait for more confirmation. If the price breaks the swing high then bias can be shifted from bearish to bullish.
See the Video To find details analysis and signals
Our Trading Plan for ERUSUSD
Based on the analysis of the daily chart, it seems that the market is currently in a strong bearish trend and approaching the extreme demand zone. As per our trading plan, we will be looking for an opportunity to go short from the supply zone, provided that we receive confirmation of a potential reversal in the market’s direction.
It will be important to monitor the price action closely and wait for a clear signal before entering the trade. If the price breaks the swing high, this would invalidate our setup and we would need to reassess the market and potentially adjust our trading plan.
Overall, it is important to remain patient and disciplined when trading and to always have a well-defined plan in place to manage risk and maximize potential profits.
[/vc_column_text][us_separator size=”large”][vc_column_text] Important Market Updates, Analysis, and Trading Plans Based on the market order flow Method in our YouTube Channel.
USDCAD is still respecting yesterday’s bearish failed auction view. Price is reacting near the 4H reaction zone, and a break below short-term demand can open downside targets.
USDCAD is accumulating near a key 4H demand zone after a possible failed auction. Roy’s analysis focuses on whether price can close below demand and open a bearish move toward lower liquidity.
AUDUSD is trading near a bullish point of interest after sweeping short-term liquidity. If price holds the demand zone and confirms bullish order flow, the next focus stays on upside liquidity targets.
EURUSD remains under short-term bearish pressure after breaking 4H structure, but price is moving toward key bullish POI zones. This weekly analysis reviews the main liquidity areas, demand levels, bullish confirmation plan, invalidation level, and the Fed-related catalyst that can guide the next move.
EUR/USD is trading near a key bullish POI after sweeping internal sell-side liquidity, but USD strength keeps pressure on the pair. Read the full breakdown to see the demand zone, confirmation plan, upside targets, and invalidation level
By mid-July, the duo achieved a high that lasted for several months at 1.1276. However, the euro lost its value as the dollar gained strength, prompting sellers to take control. Recently, bears were able to establish themselves around the 1.08 mark, but they were unable to remain under the support level of 1.0850.
EURUSD in the Correction Phase In Daily Chart
Based on our observations in the daily time frame, the market has been exhibiting a bullish trend in recent weeks. However, we have now noticed a retracement towards the lower end, which could indicate a correction phase. The initial reaction was in favor of the US dollar due to the Federal Reserve’s hawkish stance, but this has since faded away, Although the markets have largely ignored this data so far, there may be increased price volatility closer to the release of the NFP figure.
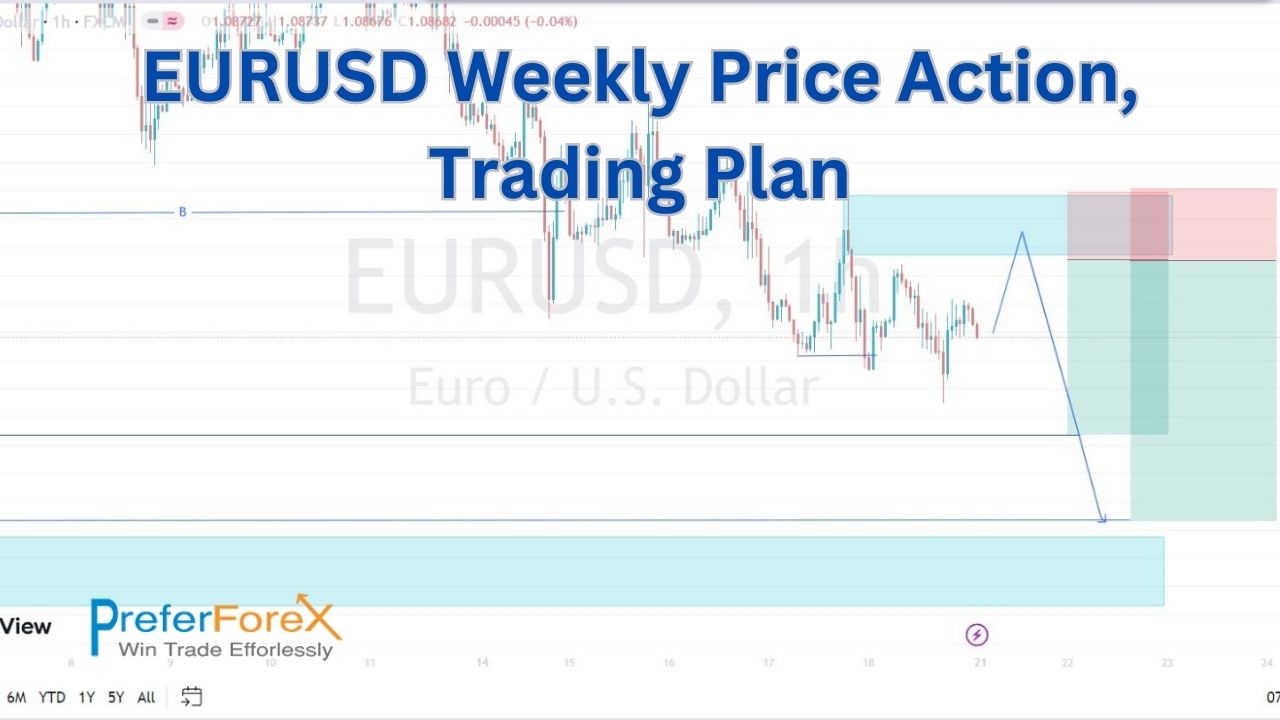
Based on the analysis of the 4-hour chart, it appears that the market attempted to move in a bullish direction but was met with resistance and was unable to establish any significant bullish patterns. This suggests that there may be some remaining liquidity on the downside, meaning that the market could potentially continue to move in a bearish direction. It’s important to keep an eye on the market’s movements and patterns to gain a better understanding of its direction and potential future movements. Also, the market has broken its recent lower low which also indicates that the market will continue a bearish trend to take off liquidity from the left. Now, look on the left side, Here is an equal low pattern usually it’s a liquidity pool & Market may take off this liquidity.
See the Video To find details analysis and signals
It is also considerable that below the liquidity pool there is also a demand zone, so most probably market will down to this demand area also.
Micro Structure in 1 Hour chart
Looking at the 1-hour chart, it appears that the market has broken through the recent low. Additionally, there is a supply zone present which suggests that the market may attempt to mitigate this zone before continuing to move in a bearish direction. It’s important to keep in mind that while this zone may provide some temporary support, it’s not a guarantee that the market will reverse its trend. It’s important to continue monitoring the market’s movements and patterns to gain a better understanding of its direction and potential future movements.
Our Trading Plan for ERUSUSD
Finally, based on the analysis of the market, it seems that the trading plan is to enter into a short trade from the supply zone, provided that all other aspects are met. If this trade is executed, there will be two targets to consider. The first target will be the nearest liquidity pool, which is a level where there is a significant amount of buy orders and liquidity. The second target will be the demand zone, which is a level where there are a significant number of buy orders and demand for the asset. It’s important to keep an eye on the market’s movements and patterns to ensure that all other aspects of the trading plan are met before entering into a trade. Additionally, it’s important to have a solid risk management plan in place to minimize potential losses. [/vc_column_text][us_separator size=”large”][vc_column_text] Important Market Updates, Analysis, and Trading Plans Based on the market order flow Method in our YouTube Channel.
USDCAD is still respecting yesterday’s bearish failed auction view. Price is reacting near the 4H reaction zone, and a break below short-term demand can open downside targets.
USDCAD is accumulating near a key 4H demand zone after a possible failed auction. Roy’s analysis focuses on whether price can close below demand and open a bearish move toward lower liquidity.
AUDUSD is trading near a bullish point of interest after sweeping short-term liquidity. If price holds the demand zone and confirms bullish order flow, the next focus stays on upside liquidity targets.
EURUSD remains under short-term bearish pressure after breaking 4H structure, but price is moving toward key bullish POI zones. This weekly analysis reviews the main liquidity areas, demand levels, bullish confirmation plan, invalidation level, and the Fed-related catalyst that can guide the next move.
EUR/USD is trading near a key bullish POI after sweeping internal sell-side liquidity, but USD strength keeps pressure on the pair. Read the full breakdown to see the demand zone, confirmation plan, upside targets, and invalidation level
The present market landscape is characterized by a prevailing bullish trend, indicative of a period where asset prices have been on an upward trajectory. This upward momentum signifies a collective optimism among market participants, as buying activity outpaces selling, propelling prices to higher levels. However, it’s important to recognize that even within an overarching bullish trend, the market is not devoid of intermittent adjustments. At this juncture, we find the market in the midst of a correction phase. A correction is a natural and healthy occurrence in financial markets, as it serves to recalibrate prices after a prolonged period of upward movement. During these phases, asset prices may exhibit a retracement, where they temporarily move in the opposite direction of the trend. This can be attributed to profit-taking by some investors, a reevaluation of market fundamentals, or the emergence of counteracting market forces.
The lower Time Frame shows the Key Levels
The hourly chart of this video, it shows some short-term demand zones. A comprehensive analysis of this specific time frame reveals the emergence of a significant phenomenon – the formation of a short-term demand zone.
How to utilize it in your strategy
The creation of a short-term demand zone on the one-hour chart holds notable implications. It signifies that within the microcosm of this time frame, traders are actively engaging with the market, identifying opportunities to buy at perceived advantageous price levels. This demand zone acts as a testament to market participants’ confidence in the asset’s value within this specific range. For traders, this insight could serve as a strategic point of reference. The short-term demand zone presents a potential entry point for those seeking to align their positions with the prevailing upward momentum. Additionally, it highlights a region where stop-loss orders might be placed to mitigate risk, as a breach below the demand zone could indicate a shift in market sentiment.
GBPUSD Weekly Trading Plan
At the part of the video, we show the clear entry zone and targets. We are anticipating the market will resume its bullish movement from one of those demand areas. Moreover, you can find exact entry-exit levels in your WhatsApp number and get 15 days of trial signals. One of the demand areas is expected to be the starting point for the market’s bullish movement. However, there is an intermediate bearish swing point. Price can react to this supply also. Please So, that our first target is this liquidity zone and the next target is this lower high point. Happy trading.
[/vc_column_text][us_separator size=”large”][vc_column_text] Important Market Updates, Analysis, and Trading Plans Based on the market order flow Method in our YouTube Channel.
USDCAD is still respecting yesterday’s bearish failed auction view. Price is reacting near the 4H reaction zone, and a break below short-term demand can open downside targets.
USDCAD is accumulating near a key 4H demand zone after a possible failed auction. Roy’s analysis focuses on whether price can close below demand and open a bearish move toward lower liquidity.
AUDUSD is trading near a bullish point of interest after sweeping short-term liquidity. If price holds the demand zone and confirms bullish order flow, the next focus stays on upside liquidity targets.
EURUSD remains under short-term bearish pressure after breaking 4H structure, but price is moving toward key bullish POI zones. This weekly analysis reviews the main liquidity areas, demand levels, bullish confirmation plan, invalidation level, and the Fed-related catalyst that can guide the next move.
EUR/USD is trading near a key bullish POI after sweeping internal sell-side liquidity, but USD strength keeps pressure on the pair. Read the full breakdown to see the demand zone, confirmation plan, upside targets, and invalidation level
The GBP/USD (British pound/US dollar) currency pair had mixed movements yesterday. The pair fluctuated between the values of 1.2620 and 1.2725, ultimately ending the day with no significant changes. Today, the pair increased slightly and reached a level of 1.2740. However, if there is a sudden increase then the price is followed by a break of the resistance level at 1.2796, it will likely maintain a bullish trend in the short term and shift the bias toward an upward direction. As of August 4, 2023, the GBP/USD currency pair is facing potential volatility due to the release of the Non-Farm Payrolls (NFP) report. The NFP data is a crucial economic indicator released by the U.S. Bureau of Labor Statistics, which measures the number of non-farm jobs added or lost in the United States during the previous month
GBPUSD Price Action
The GBP/USD currency pair has been under the spotlight recently as traders closely monitor its movements. After a period of consolidation, market order flow suggests that the pair may be gearing up for a bullish run from a significant support area, known as the extreme demand zone. In this post, we will look into the reasons behind this potential upward movement, exploring the key factors that could influence GBP/USD’s trajectory and the implications for traders.
The extreme demand zone that we show in the video analysis is a specific area where the price has historically experienced strong buying interest, preventing further downward movement. Traders often consider these zones as potential turning points in the market, as demand typically outweighs supply, leading to upward price movements.
Non-Firm Payroll Impact on GBPUSD
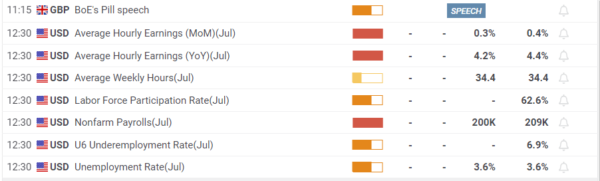
Today is NFP release day, GBP/USD currency pair and its recent movements before NFP, The GBP/USD has been trading above the support level of 1.2700, which has helped it to recover from a four-day losing streak. The Bank of England (BoE) is expected to announce a 25 basis point increase in the policy rate to 5.25%, but the market needs reassurance that the BoE will continue to tighten policy despite easing price pressure. A 50 bps rate increase could provide strength to the Pound Sterling, but it could also signal an end to the tightening cycle. On the other hand, a 25 bps hike combined with a dovish message acknowledging softer inflation and loss of momentum in economic growth could trigger a fresh leg lower in GBP/USD. Cable holds a positive note above 1.2700, snapping a four-day losing streak in early Europe on Friday. Investors digest the dovish BoE outlook amid a modest pullback in the US Dollar, supporting the pair ahead of the critical US NFP release.
The initial reaction was in favor of the US dollar due to the Federal Reserve’s hawkish stance, but this has since faded away. Although the markets have largely ignored this data so far, there may be increased price volatility closer to the release of the NFP figure.
While the outlook appears bullish, traders need to exercise prudent risk management. Trading involves inherent risks, and market sentiment can quickly change. To mitigate potential losses, consider the following:
Set Stop-Loss Orders: Determine a suitable stop-loss level below the extreme demand zone to limit losses in case of an unexpected market reversal.
Monitor Price Action: Watch for confirmation of the bullish move through price action patterns and candlestick formations. An engulfing bullish pattern or a hammer could signal a potential reversal.
Keep Abreast of News Events: Stay informed about economic events and political developments that could impact the GBP/USD pair, as sudden news can disrupt technical patterns.
Get our Institutional forex signals FREE trial. With every subscription, we provide a free risk management guide to enhance your trading quality. With every signal we provide clear stop loss and target and depending on price action we send close notifications if required to close early.
USDCAD is still respecting yesterday’s bearish failed auction view. Price is reacting near the 4H reaction zone, and a break below short-term demand can open downside targets.
USDCAD is accumulating near a key 4H demand zone after a possible failed auction. Roy’s analysis focuses on whether price can close below demand and open a bearish move toward lower liquidity.
AUDUSD is trading near a bullish point of interest after sweeping short-term liquidity. If price holds the demand zone and confirms bullish order flow, the next focus stays on upside liquidity targets.
EURUSD remains under short-term bearish pressure after breaking 4H structure, but price is moving toward key bullish POI zones. This weekly analysis reviews the main liquidity areas, demand levels, bullish confirmation plan, invalidation level, and the Fed-related catalyst that can guide the next move.
EUR/USD is trading near a key bullish POI after sweeping internal sell-side liquidity, but USD strength keeps pressure on the pair. Read the full breakdown to see the demand zone, confirmation plan, upside targets, and invalidation level
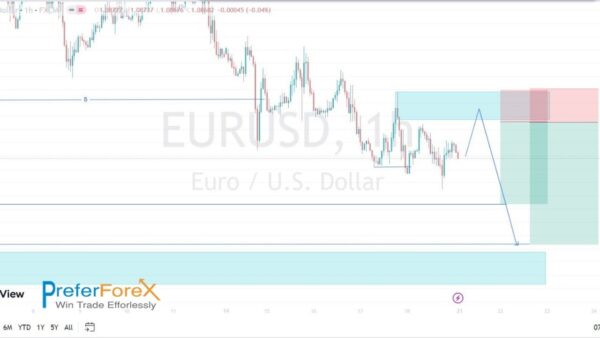
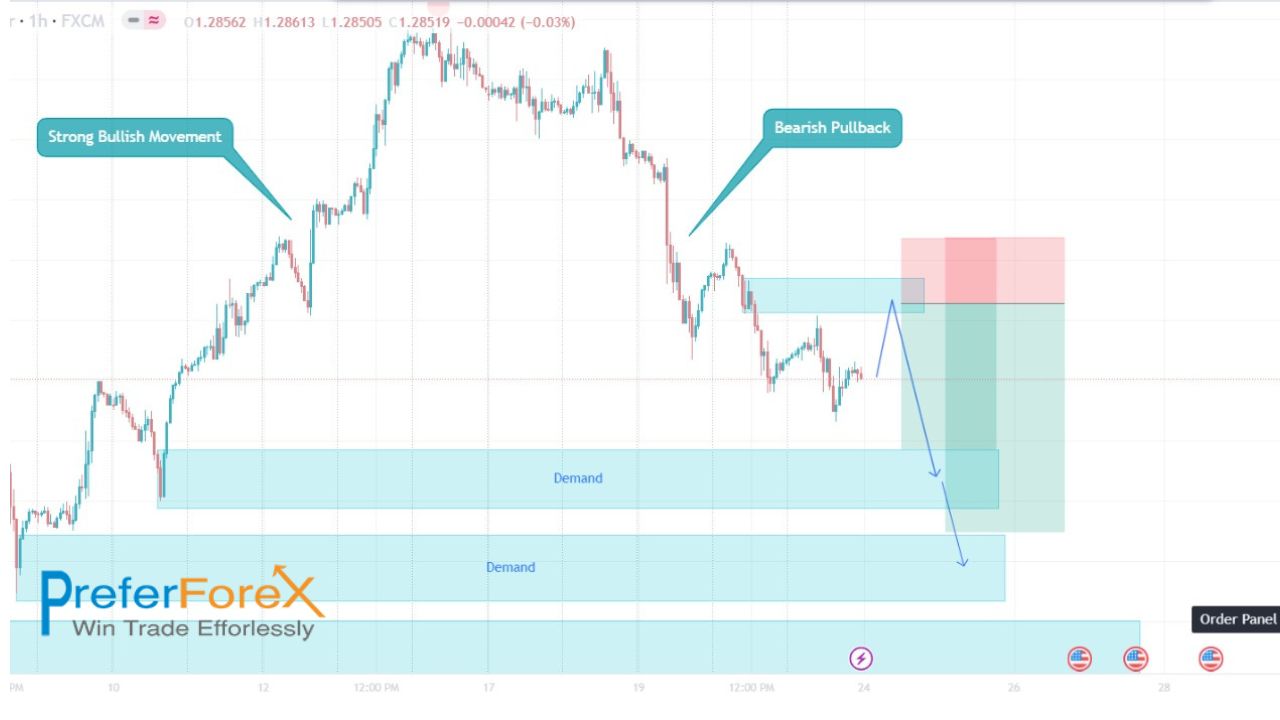
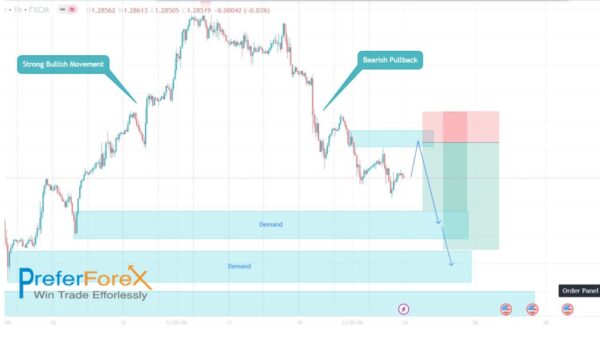
Last week, the GBP/USD experienced a strong bullish movement, resulting in a significant high and positive momentum in the market. However, a bearish pullback has since occurred, indicating a temporary pause in the market. This is a common occurrence in forex trading and allows traders to reassess their positions and potentially enter new positions at more favorable levels.
As we evaluate this week’s GBPUSD market conditions, we have identified two demand zones as potential targets for upcoming price movements. These demand zones represent areas where buyers could step in, leading to potential price reversals or extended bullish moves. It’s important for traders to be cautious during this pullback phase and keep a close eye on the immediate support and resistance levels.
If the price action indicates strong bullish momentum near the demand zones, it could present a buying opportunity. We show in this video the target so that you can take the decision on a price-action basis. We shall update the signal in the premium member area accordingly. Join our premium forex signals free for 15 days. However, proper risk management and a clear exit plan are essential for any trading strategy. It’s important to note that forex trading involves inherent risks and market movements can be unpredictable.
This analysis is for informational purposes only and should not be considered financial advice. Always conduct your analysis and consult with a professional financial advisor before making any trading decisions.
[/vc_column_text][us_separator size=”large”][vc_column_text] All of the Analysis is based on the market order flow Method. It is one of the most popular methods for institutional traders. In the premium member area, there is some discussion on the method like-
USDCAD is still respecting yesterday’s bearish failed auction view. Price is reacting near the 4H reaction zone, and a break below short-term demand can open downside targets.
USDCAD is accumulating near a key 4H demand zone after a possible failed auction. Roy’s analysis focuses on whether price can close below demand and open a bearish move toward lower liquidity.
AUDUSD is trading near a bullish point of interest after sweeping short-term liquidity. If price holds the demand zone and confirms bullish order flow, the next focus stays on upside liquidity targets.
EURUSD remains under short-term bearish pressure after breaking 4H structure, but price is moving toward key bullish POI zones. This weekly analysis reviews the main liquidity areas, demand levels, bullish confirmation plan, invalidation level, and the Fed-related catalyst that can guide the next move.
EUR/USD is trading near a key bullish POI after sweeping internal sell-side liquidity, but USD strength keeps pressure on the pair. Read the full breakdown to see the demand zone, confirmation plan, upside targets, and invalidation level
[vc_row columns=”2-1″ css=”%7B%22default%22%3A%7B%22padding-right%22%3A%2225px%22%7D%7D”][vc_column width=”5/6″][us_post_date format=”jS F Y” css=”%7B%22default%22%3A%7B%22font-family%22%3A%22Tahoma%2C%20Geneva%2C%20sans-serif%22%7D%7D”][us_separator size=”large”][vc_column_text]
US Dollar Hit to 2-month low, while GBP rose to a 15-month high
On Tuesday, the US dollar experienced a decline, reaching its lowest point in two months. This depreciation occurred following indications from Federal Reserve officials suggesting that the central bank was approaching the conclusion of its tightening cycle. Conversely, the British pound surged to a 15-month high after exceeding expectations with strong growth in wages.
Important Fundamental Release
On Monday, multiple Federal Reserve officials expressed the view that to combat inflation, the central bank would likely need to implement further interest rate hikes. However, they also acknowledged that the end of the current cycle of monetary policy tightening was drawing near.
These comments resulted in a decrease in the value of the US dollar, with its index against a basket of currencies (DXY) reaching a two-month low of 101.66. As a consequence, traders adjusted their expectations regarding the extent to which US interest rates might need to rise in the future.
Weekly Pirce Action Incidate GBP will be continued Bullish
About our Weekly Forecast – We said the market will be short-term bearish and after GBPUSD will be bullish again.
Here is the analysis on YouTube
In this video, we share that After a brief pullback, the pair GBPUSD will be continued upward movement from a demand zone and, the pair is now aiming for the next supply zone. If we switch to the one-hour chart, we can observe that the price has broken its recent high point. However, it is now showing a reaction to this higher high. So, we can expect a short-term bearish movement before resuming its bullish movement. On the chart, there is a noticeable demand zone that has effectively taken off liquidity from previous lows and broken the high.
before this demand area, there is also a liquidity zone. It is possible that the market may test this zone in order to collect additional liquidity before resuming its bullish movement. It’s also important to note that at the bottom of the bullish movement, there is another demand zone price that may retest that area also. As a result, we should be prepared for both scenarios.
Hope this analysis helps you to make some profit this week.
[/vc_column_text][us_separator size=”large”][vc_column_text css=”%7B%22default%22%3A%7B%22padding-left%22%3A%2215px%22%2C%22padding-top%22%3A%2215px%22%2C%22padding-bottom%22%3A%2215px%22%2C%22padding-right%22%3A%2215px%22%2C%22animation-name%22%3A%22afb%22%7D%7D”]Important Market Updates, Analysis, and Trading Plans Based on the market order flow Method in our YouTube Channel.
USDCAD is still respecting yesterday’s bearish failed auction view. Price is reacting near the 4H reaction zone, and a break below short-term demand can open downside targets.
USDCAD is accumulating near a key 4H demand zone after a possible failed auction. Roy’s analysis focuses on whether price can close below demand and open a bearish move toward lower liquidity.
AUDUSD is trading near a bullish point of interest after sweeping short-term liquidity. If price holds the demand zone and confirms bullish order flow, the next focus stays on upside liquidity targets.
EURUSD remains under short-term bearish pressure after breaking 4H structure, but price is moving toward key bullish POI zones. This weekly analysis reviews the main liquidity areas, demand levels, bullish confirmation plan, invalidation level, and the Fed-related catalyst that can guide the next move.
EUR/USD is trading near a key bullish POI after sweeping internal sell-side liquidity, but USD strength keeps pressure on the pair. Read the full breakdown to see the demand zone, confirmation plan, upside targets, and invalidation level
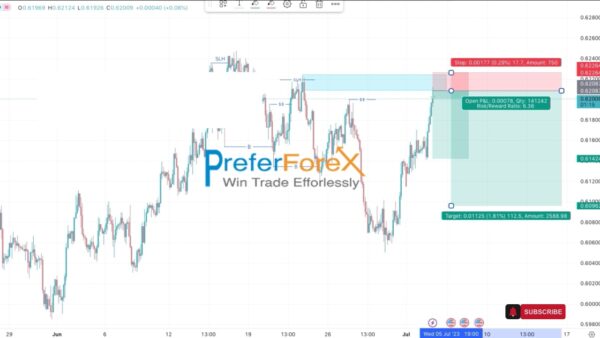
As per the price action, there is a short-term selling opportunity for NZD/USD. Here, we will discuss the trading potential of NZD/USD and focus on a trading plan that involves entering the market from the nearest supply zone.
The pairs experienced a temporary uptrend. However, it’s crucial to recognize the presence of a nearby supply zone, which could act as a resistance area and potentially lead to a price reversal.
Based on our analysis, we anticipate a short-term upward trend. However, on the upside there is a nearby supply zone that could potentially act as a barrier, leading to a price rebound.
Identify the Nearest Supply Zone: Here we show the nearest supply zone on the NZD/USD chart. This area represents a potential selling opportunity.
Entry Strategy: Plan your entry by setting a sell limit order just below the supply zone. This approach allows you to enter the trade at an optimal price if the price retraces from the supply zone.
Risk Management: Place a stop-loss order above the supply zone or a level that offers a reasonable buffer. This helps protect your capital in case the price breaks out of the supply zone.
Profit Targets: Determine your profit targets based on your risk-reward ratio and consider setting them near support levels or previous swing lows.
USDCAD is still respecting yesterday’s bearish failed auction view. Price is reacting near the 4H reaction zone, and a break below short-term demand can open downside targets.
USDCAD is accumulating near a key 4H demand zone after a possible failed auction. Roy’s analysis focuses on whether price can close below demand and open a bearish move toward lower liquidity.
AUDUSD is trading near a bullish point of interest after sweeping short-term liquidity. If price holds the demand zone and confirms bullish order flow, the next focus stays on upside liquidity targets.
EURUSD remains under short-term bearish pressure after breaking 4H structure, but price is moving toward key bullish POI zones. This weekly analysis reviews the main liquidity areas, demand levels, bullish confirmation plan, invalidation level, and the Fed-related catalyst that can guide the next move.
EUR/USD is trading near a key bullish POI after sweeping internal sell-side liquidity, but USD strength keeps pressure on the pair. Read the full breakdown to see the demand zone, confirmation plan, upside targets, and invalidation level
 This top-down analysis is based on the smart money and price action concept. To learn the actual smart money concept trading and how to identify high-potential and low-risk entry points, You can enroll in our course, which is completely free to sign up for. Join The FREE course
 USDCAD is still respecting yesterday’s bearish failed auction view. Price is reacting near the 4H reaction zone, and a break below short-term demand can open downside targets.
 USDCAD is accumulating near a key 4H demand zone after a possible failed auction. Roy’s analysis focuses on whether price can close below demand and open a bearish move toward lower liquidity.
 AUDUSD is trading near a bullish point of interest after sweeping short-term liquidity. If price holds the demand zone and confirms bullish order flow, the next focus stays on upside liquidity targets.
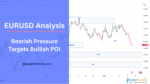 EURUSD remains under short-term bearish pressure after breaking 4H structure, but price is moving toward key bullish POI zones. This weekly analysis reviews the main liquidity areas, demand levels, bullish confirmation plan, invalidation level, and the Fed-related catalyst that can guide the next move.
 This is our trading plan


 The pairs experienced a temporary uptrend. However, it’s crucial to recognize the presence of a nearby supply zone, which could act as a resistance area and potentially lead to a price reversal.