[vc_row us_bg_image_source=”featured” us_bg_overlay_color=”_alt_content_link” css=”%7B%22default%22%3A%7B%22color%22%3A%22_header_transparent_text_hover%22%2C%22background-image%22%3A%2236586%22%2C%22animation-name%22%3A%22afb%22%7D%7D”][vc_column width=”1/1″][vc_column_text]
EURUSD Top-Down Analysis and Possible Direction
Based on Smart Money Trading
[/vc_column_text][/vc_column][/vc_row][vc_row][vc_column width=”1/6″][/vc_column][vc_column width=”2/3″][us_post_date][us_separator size=”small” show_line=”1″ thick=”2″][vc_column_text]
[/vc_column_text][vc_column_text]
According to the daily chart, the price is currently following a bearish structure. The most recent break of structure happened at 1.0700 level. The recent bullish movement is the retracement movement, which takes out the inducement liquidity and then begins to react.
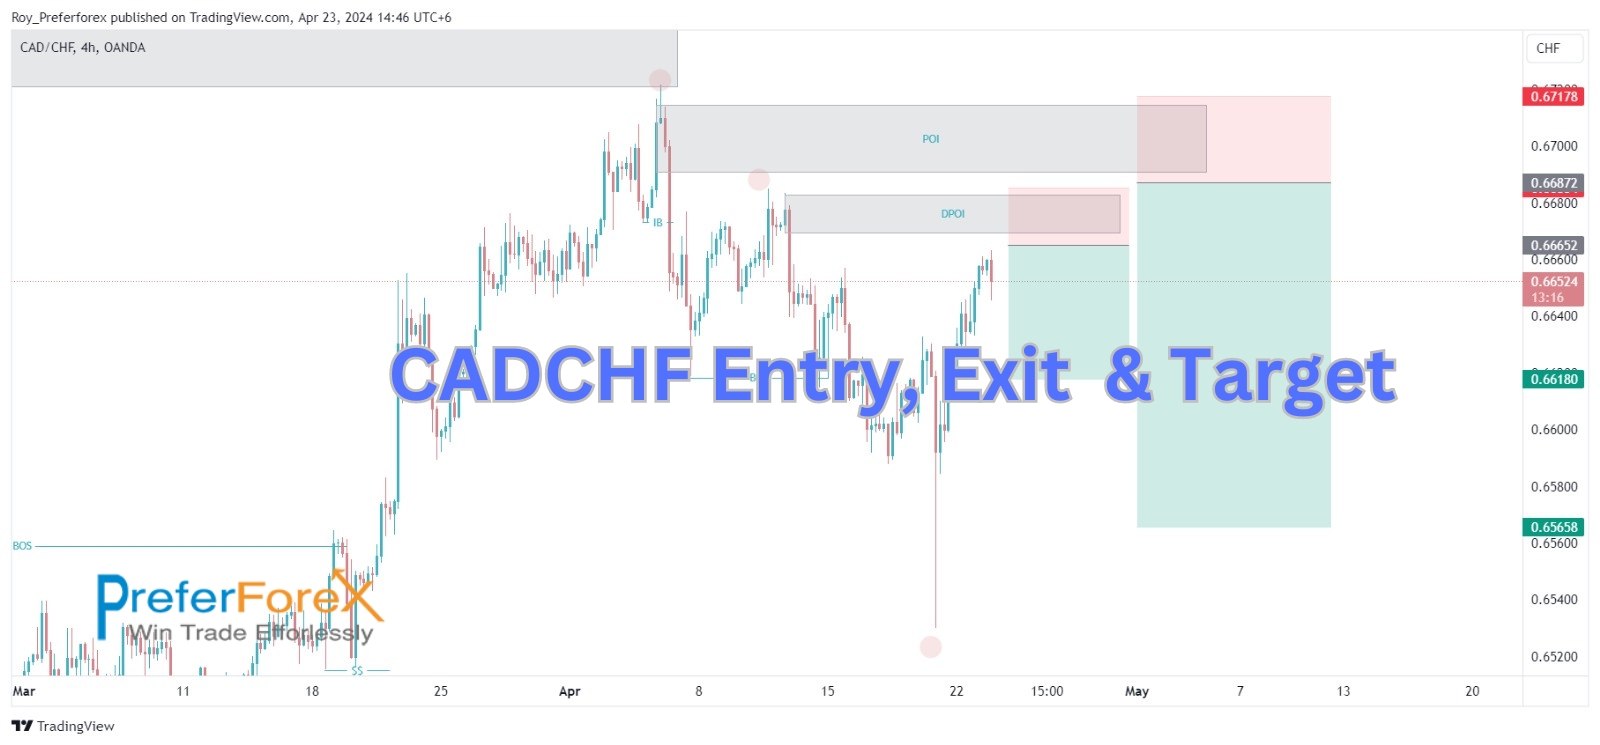
On the 4-hour chart, we can see the price is moving upwards by following the bullish market structure. Now it is reacting on a POI. Since the market structure is bearish on the daily time frame, we can anticipate a bearish movement from this POI targeting the short-term POIs marked on the chart. If the price reacts from those short-term POI, then we may see another swing high, but if the price breaks the recent short-term swing low, then we can expect further bearish movement targeting the low of the chart. Please watch the video for detailed insight 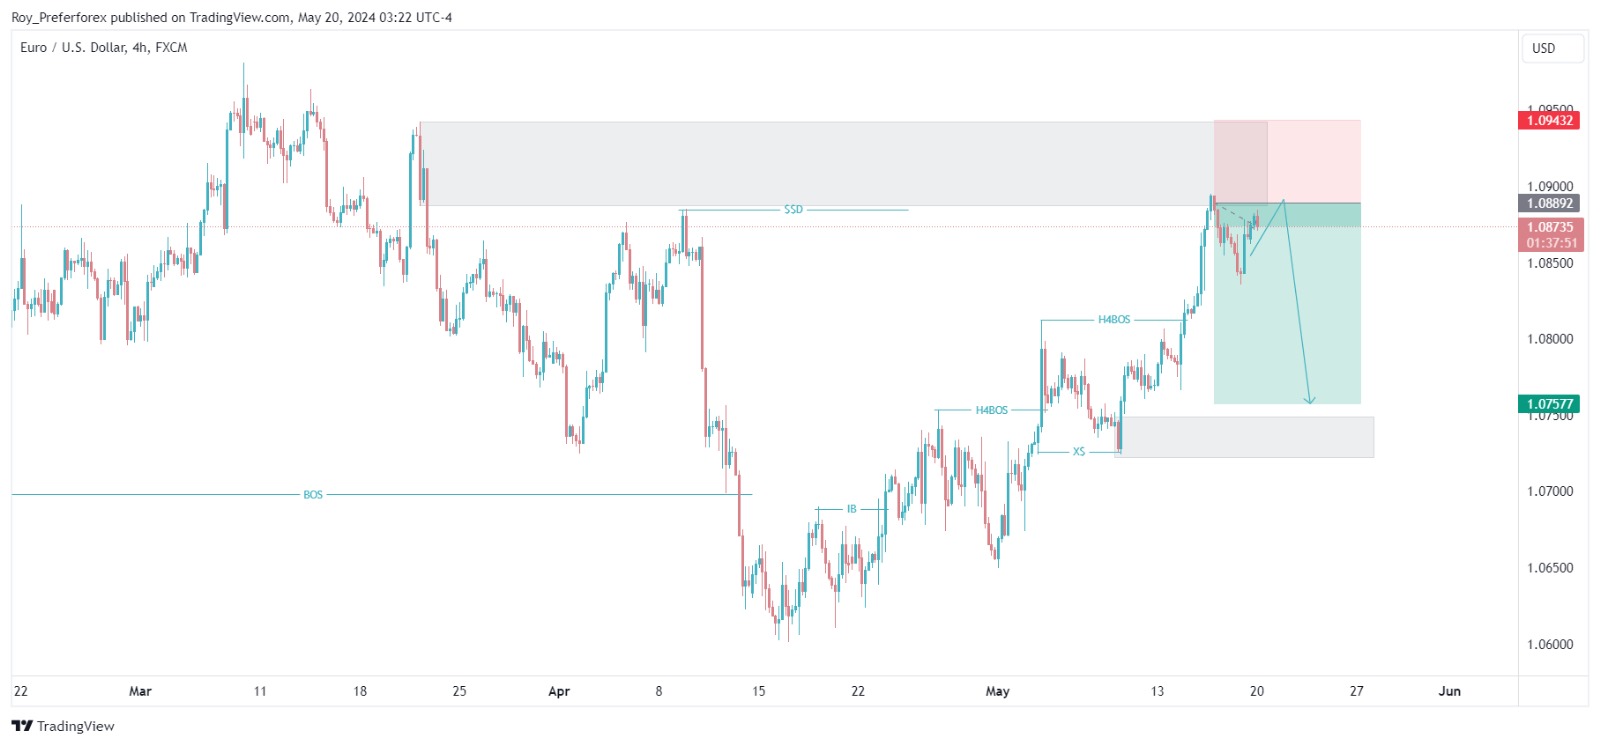 This top-down analysis is based on the smart money and price action concept. To learn the actual smart money concept trading and how to identify high-potential and low-risk entry points, You can enroll in our course, which is completely free to sign up for. Join The FREE course

[/vc_column_text][/vc_column][vc_column width=”1/6″][us_image image=”39209″ align=”left” link=”%7B%22url%22%3A%22https%3A%2F%2Fpreferforex.com%2Fforex-trading-course%2F%22%7D”][/vc_column][/vc_row][vc_row height=”auto”][vc_column width=”1/1″][vc_column_text]
Recent Posts
[/vc_column_text][us_separator size=”small” show_line=”1″ line_width=”30″][vc_column_text]
- USDCAD Price Update: Bearish Setup Holds Near Failed Auction Zone
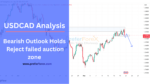 USDCAD is still respecting yesterday’s bearish failed auction view. Price is reacting near the 4H reaction zone, and a break below short-term demand can open downside targets.
 - USDCAD Analysis: Failed Auction Near Demand Zone
 USDCAD is accumulating near a key 4H demand zone after a possible failed auction. Roy’s analysis focuses on whether price can close below demand and open a bearish move toward lower liquidity.
 - AUDUSD Analysis: Bullish POI & Liquidity Sweep
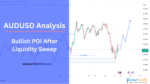 AUDUSD is trading near a bullish point of interest after sweeping short-term liquidity. If price holds the demand zone and confirms bullish order flow, the next focus stays on upside liquidity targets.
 - EEURUSD Analysis: Bearish Pressure Targets Bullish POI
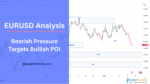 EURUSD remains under short-term bearish pressure after breaking 4H structure, but price is moving toward key bullish POI zones. This weekly analysis reviews the main liquidity areas, demand levels, bullish confirmation plan, invalidation level, and the Fed-related catalyst that can guide the next move.
 - EURUSD Analysis Today: Bullish POI in Focus After USD StrengthEUR/USD is trading near a key bullish POI after sweeping internal sell-side liquidity, but USD strength keeps pressure on the pair. Read the full breakdown to see the demand zone, confirmation plan, upside targets, and invalidation level
- Institutional Order FlowJoin Now Institutional Order Flow: The Foundation of Smart Money Trading Why understanding institutional capital … Read more