
[vc_row height=”auto” us_bg_image_source=”media” us_bg_image=”5786″ us_bg_parallax=”vertical” content_placement=”middle” us_shape_show_bottom=”1″ us_shape_bottom=”custom” us_shape_height_bottom=”14vh” us_shape_flip_bottom=”1″][vc_column][/vc_column][/vc_row][vc_row columns=”2-1″ columns_gap=”4rem” css=”%7B%22default%22%3A%7B%22padding-right%22%3A%2225px%22%7D%7D”][vc_column width=”5/6″][us_post_date format=”jS F Y” css=”%7B%22default%22%3A%7B%22font-family%22%3A%22Tahoma%2C%20Geneva%2C%20sans-serif%22%7D%7D”][us_separator size=”small” show_line=”1″ thick=”2″][vc_column_text]
GBP / USD ahead of the US NFP
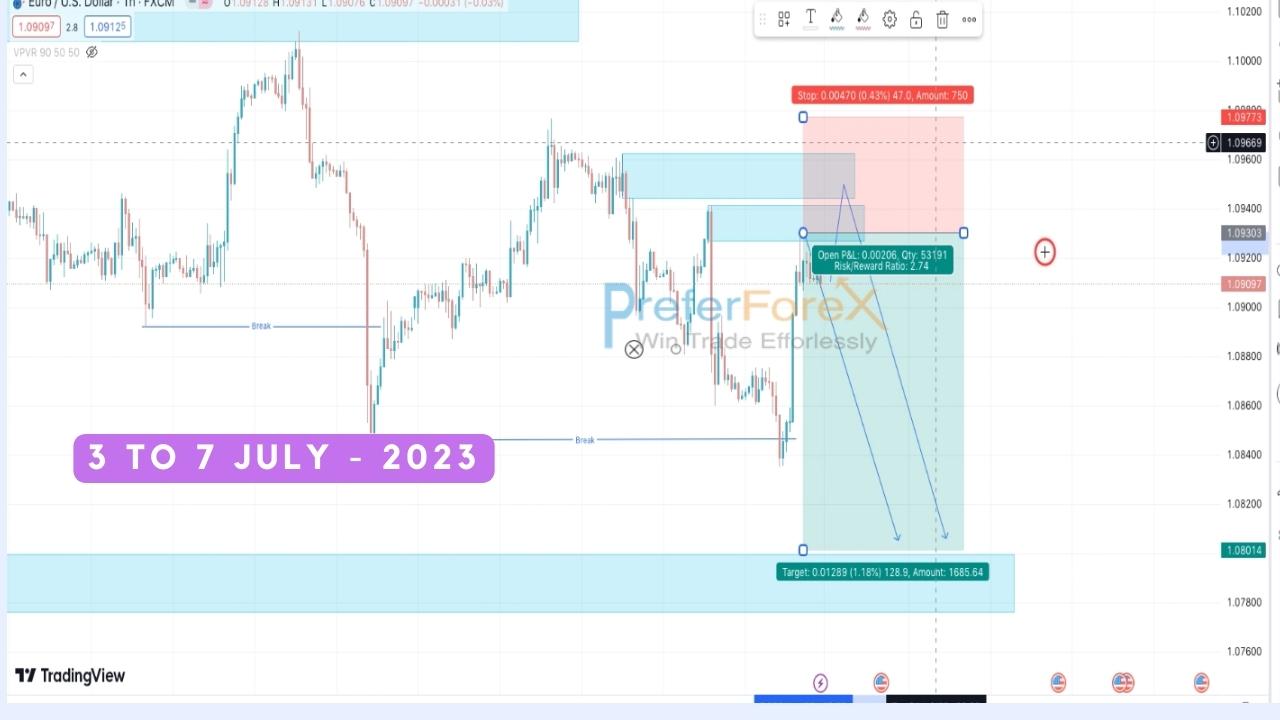
The GBP/USD currency pair has rebounded from its lowest point in seven months, which was at $1.2038. As a result, the pair has surpassed its downtrend channel resistance line at $1.2178, and it is now approaching last week’s high of $1.2271
GBPUSD Price Action
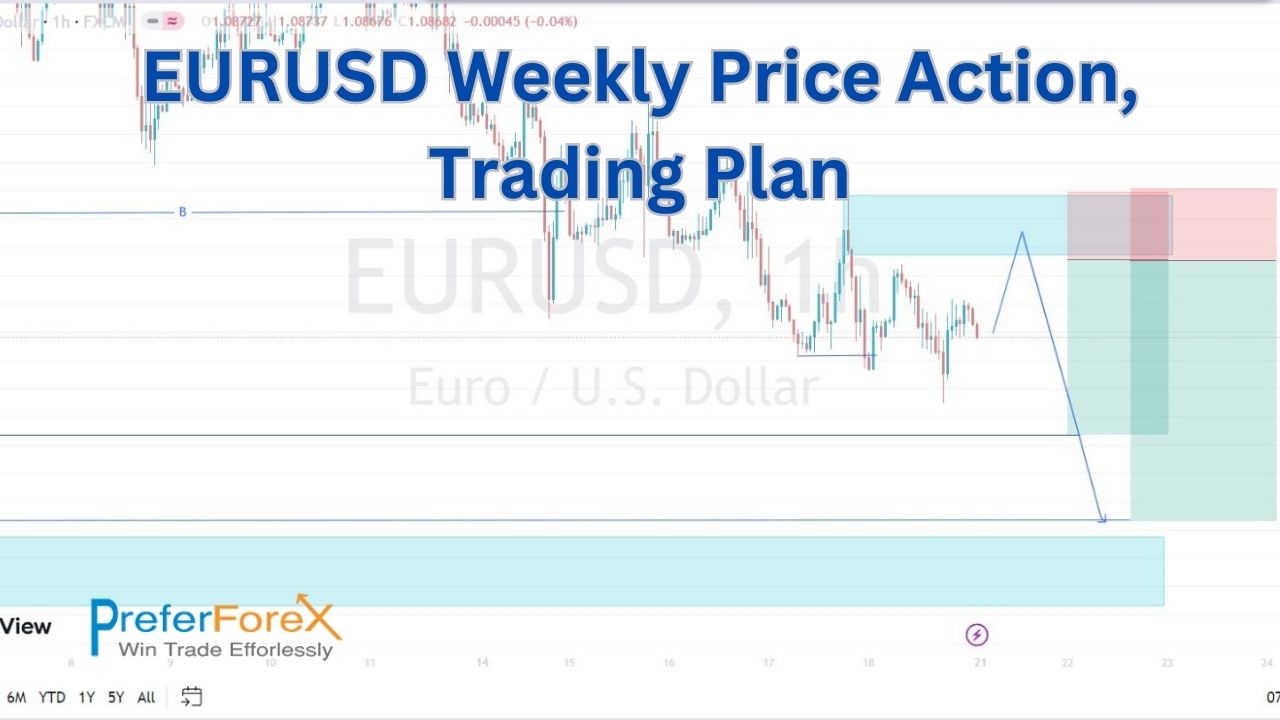
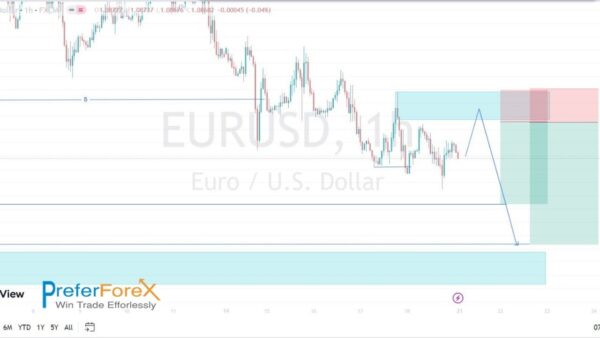
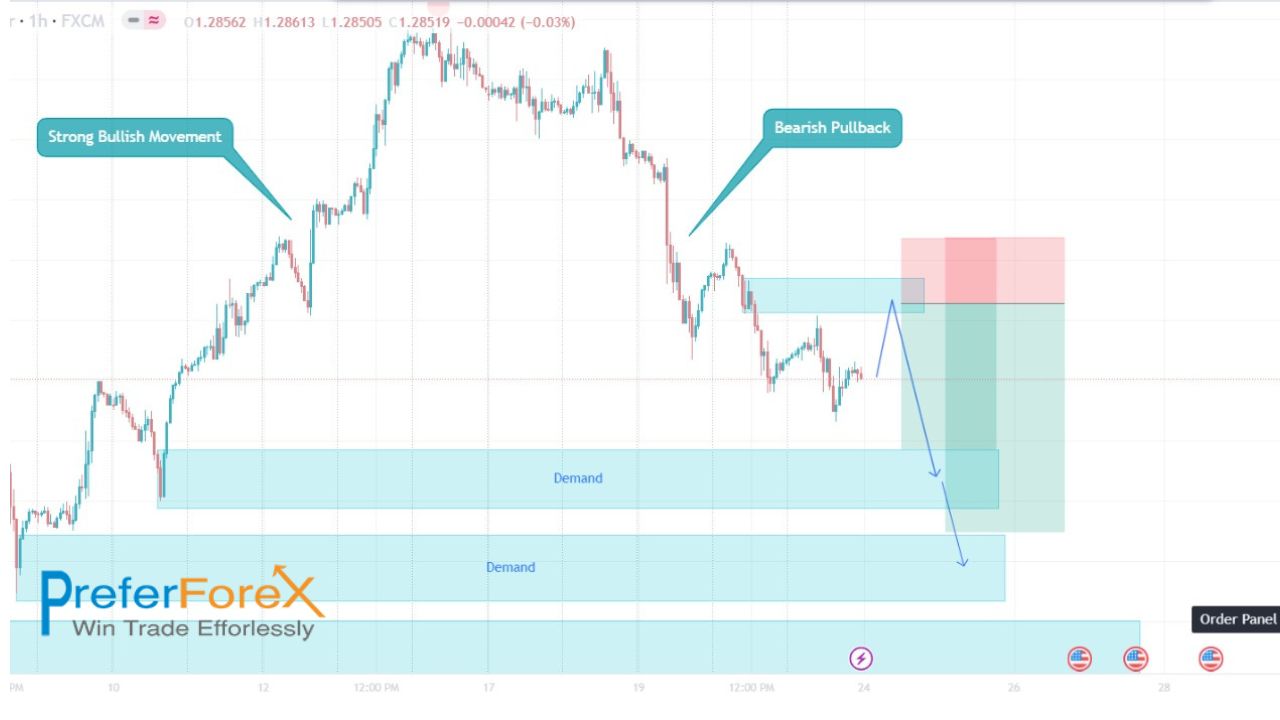
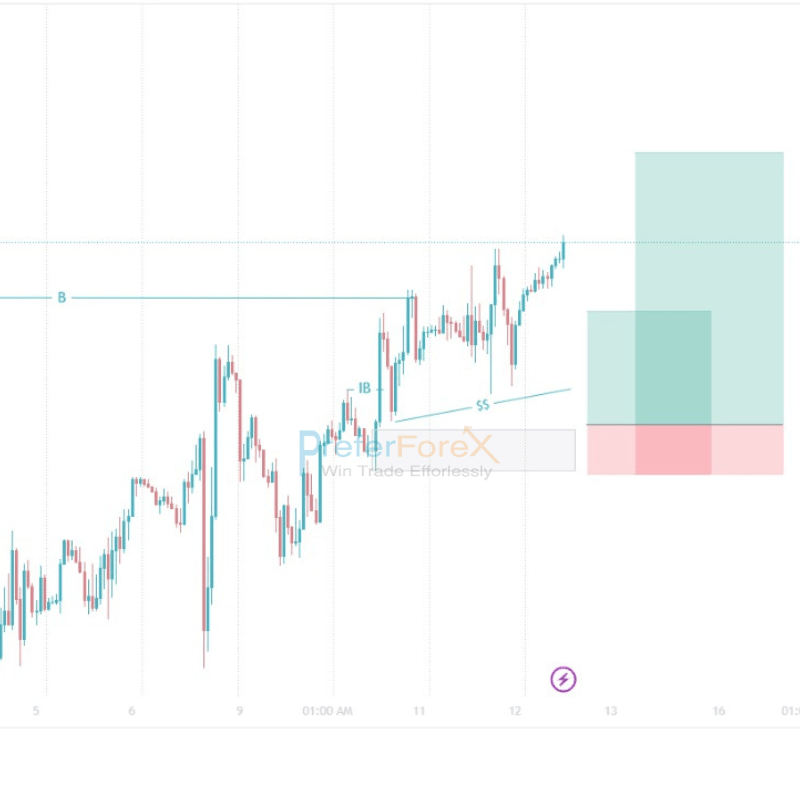
The main trend of GBP/USD is currently bullish. However, you believe that the currency pair is currently in a retracement phase and will soon approach a support zone that you have indicated in a video. You anticipate that once the pair reaches this support zone, it will begin to decline again, particularly during the release of the Non-Farm Payroll (NFP) report. It’s worth noting that NFP is a major economic indicator that can have a significant impact on the forex market, and traders often adjust their positions accordingly.
release.
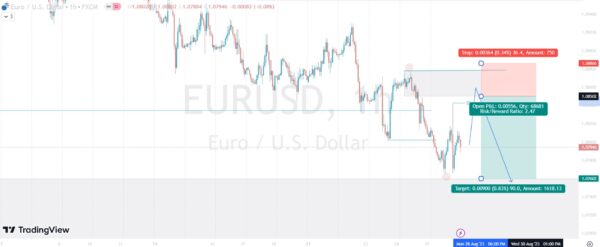
 This is our trading plan
Understanding the Current State
As of the latest market analysis, the GBP/USD currency pair has been on a bullish trend, indicating that the British pound (GBP) has been gaining strength against the US dollar (USD). This upward movement has been driven by various factors, including economic data, political developments, and market sentiment.
The Retracement Phase is Going on
Despite the prevailing bullish trend, experienced traders have noticed signs that the GBP/USD pair might be entering a retracement phase. A retracement is a temporary reversal in the direction of a prevailing trend. In this case, the retracement could mean a temporary decline in the GBP/USD exchange rate.
Traders have identified a specific support zone, which is an area on the price chart where they anticipate the pair may find buying interest. This support zone is crucial for understanding potential price movements in the near future. When the GBP/USD pair approaches this zone, it could either bounce back upwards or breakthrough, signaling a potential reversal.
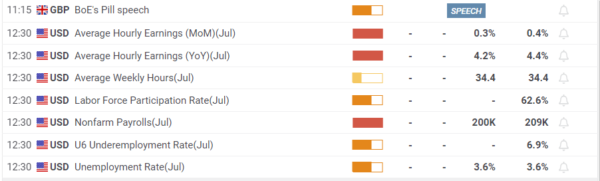
The Role of the Non-Farm Payroll (NFP) Report
The Non-Farm Payroll (NFP) report is a key economic indicator released by the U.S. Bureau of Labor Statistics on the first Friday of each month. It provides crucial data about the employment situation in the United States, including the number of new jobs created, the unemployment rate, and wage growth. The NFP report is closely watched by traders and investors worldwide because of its potential to impact the forex market significantly.
During the release of the NFP report, market volatility tends to increase, and traders often adjust their positions in response to the data. If the NFP report reveals strong job growth and positive economic indicators, it can strengthen the U.S. dollar. Conversely, if the report disappoints, it can weaken the USD.
Anticipating the Impact
Traders are paying close attention to the upcoming NFP report because it could coincide with the GBP/USD pair approaching the previously mentioned support zone. If the NFP report surprises to the upside and boosts the USD, it may push the pair further down, potentially triggering the anticipated retracement.
Conclusion
In summary, the GBP/USD currency pair has been on a bullish trend, but experienced traders are cautious about a potential retracement phase. The upcoming release of the Non-Farm Payroll (NFP) report adds an extra layer of complexity to the market, as it can have a significant impact on the forex market’s direction.
Traders will closely monitor the GBP/USD pair as it approaches the support zone, and they will be especially attentive during the NFP report release. The combination of these factors may lead to heightened volatility and trading opportunities, making it an important period for forex traders to keep a close eye on their positions and strategies
Get our Institutional forex signals FREE trial. With every subscription, we provide a free risk management guide to enhance your trading quality. With every signal we provide clear stop loss and target, and depending on price action we send close notification if required to close early.
[/vc_column_text][us_separator size=”large”][vc_column_text]
Important Market Updates, Analysis, and Trading Plans Based on the Market Order Flow Method in our YouTube Channel.
| https://www.youtube.com/@preferforex_official | |
| 🔔 Get Instantly Our Latest Forecast and Market Updates. | |
[/vc_column_text][/vc_column][vc_column sticky=”1″ link=”%7B%22url%22%3A%22%22%7D” width=”1/6″][vc_row_inner][vc_column_inner width=”1/1″][vc_column_text css=”%7B%22default%22%3A%7B%22padding-bottom%22%3A%2270px%22%7D%7D”]

[/vc_column_text][/vc_column_inner][/vc_row_inner][us_separator][vc_column_text css=”%7B%22default%22%3A%7B%22background-color%22%3A%22rgba%280%2C121%2C250%2C0.34%29%22%2C%22padding-left%22%3A%2210px%22%2C%22padding-top%22%3A%2220px%22%2C%22padding-bottom%22%3A%2210px%22%2C%22padding-right%22%3A%2210px%22%2C%22border-radius%22%3A%225px%22%2C%22border-style%22%3A%22dashed%22%2C%22border-left-width%22%3A%222px%22%2C%22border-top-width%22%3A%222px%22%2C%22border-bottom-width%22%3A%222px%22%2C%22border-right-width%22%3A%222px%22%2C%22border-color%22%3A%22%231b98e0%22%7D%7D”]
Forex Signals Service
-
Exclusive Chart – To show various trading opportunity
-
Email Alert for Every signal and update Trade
-
WhatsApp Alert for signal and update
-
Trade Management Guideline
- Trade any broker.
- Full 15-day FREE trial!
[/vc_column_text][/vc_column][/vc_row][vc_row height=”auto”][vc_column width=”1/1″][vc_column_text]
Recent Posts
[/vc_column_text][us_separator size=”small” show_line=”1″ line_width=”30″][vc_column_text]
- USDCAD Price Update: Bearish Setup Holds Near Failed Auction Zone
 USDCAD is still respecting yesterday’s bearish failed auction view. Price is reacting near the 4H reaction zone, and a break below short-term demand can open downside targets.
 - USDCAD Analysis: Failed Auction Near Demand Zone
 USDCAD is accumulating near a key 4H demand zone after a possible failed auction. Roy’s analysis focuses on whether price can close below demand and open a bearish move toward lower liquidity.
 - AUDUSD Analysis: Bullish POI & Liquidity Sweep
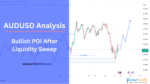 AUDUSD is trading near a bullish point of interest after sweeping short-term liquidity. If price holds the demand zone and confirms bullish order flow, the next focus stays on upside liquidity targets.
 - EEURUSD Analysis: Bearish Pressure Targets Bullish POI
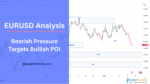 EURUSD remains under short-term bearish pressure after breaking 4H structure, but price is moving toward key bullish POI zones. This weekly analysis reviews the main liquidity areas, demand levels, bullish confirmation plan, invalidation level, and the Fed-related catalyst that can guide the next move.
 - EURUSD Analysis Today: Bullish POI in Focus After USD StrengthEUR/USD is trading near a key bullish POI after sweeping internal sell-side liquidity, but USD strength keeps pressure on the pair. Read the full breakdown to see the demand zone, confirmation plan, upside targets, and invalidation level
- Institutional Order Flow: How Smart Money Moves ForexInstitutional order flow explains how banks, funds, and large market participants move price through liquidity. This guide covers liquidity sweeps, order blocks, market structure, fair value gaps, POIs, and SMC-based trade planning.
[/vc_column_text][/vc_column][/vc_row][vc_row][vc_column us_bg_overlay_color=”rgba(0,0,0,0.50)” css=”%7B%22default%22%3A%7B%22color%22%3A%22%23ffffff%22%2C%22background-color%22%3A%22_content_secondary%22%2C%22background-image%22%3A%22https%3A%2F%2Fpreferforex.com%2Fwp-content%2Fplugins%2Fus-core%2Fassets%2Fimages%2Fplaceholder.svg%22%2C%22background-position%22%3A%220%2010%25%22%2C%22background-size%22%3A%22cover%22%2C%22padding-left%22%3A%228vh%22%2C%22padding-top%22%3A%228vh%22%2C%22padding-bottom%22%3A%227vh%22%2C%22padding-right%22%3A%228vh%22%2C%22border-radius%22%3A%2210px%22%7D%7D” width=”1/1″][us_cta title=”Start Learning Market Depth” color=”light” controls=”bottom” btn_label=”FREE Trial” btn_link=”url:https%3A%2F%2Fpreferforex.com%2Fforex-signals%2F” second_button=”1″ btn2_label=”Learn More” btn2_link=”url:https%3A%2F%2Fpreferforex.com%2Fforex-signals%2F” btn2_style=”4″ css=”%7B%22default%22%3A%7B%22background-color%22%3A%22_header_transparent_bg%22%2C%22padding-left%22%3A%220%22%2C%22padding-top%22%3A%220%22%2C%22padding-bottom%22%3A%220%22%2C%22padding-right%22%3A%220%22%7D%7D”]
Be confident like a Professional Trader, and earn what you deserve.
[/us_cta][/vc_column][/vc_row]