[vc_row height=”auto” us_bg_image_source=”media” us_bg_image=”5786″ us_bg_parallax=”vertical” content_placement=”middle” us_shape_show_bottom=”1″ us_shape_bottom=”custom” us_shape_height_bottom=”14vh” us_shape_flip_bottom=”1″][vc_column][/vc_column][/vc_row][vc_row columns=”2-1″ columns_gap=”4rem” css=”%7B%22default%22%3A%7B%22padding-right%22%3A%2225px%22%7D%7D”][vc_column width=”5/6″][us_post_date format=”jS F Y” css=”%7B%22default%22%3A%7B%22font-family%22%3A%22Tahoma%2C%20Geneva%2C%20sans-serif%22%7D%7D”][us_separator size=”small” show_line=”1″ thick=”2″][vc_column_text]
EUR / USD Outlook Today
By mid-July, the duo achieved a high that lasted for several months at 1.1276. However, the euro lost its value as the dollar gained strength, prompting sellers to take control. Recently, bears were able to establish themselves around the 1.08 mark, but they were unable to remain under the support level of 1.0850.
EURUSD in the Correction Phase In Daily Chart
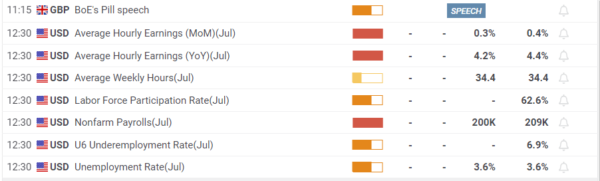
Based on our observations in the daily time frame, the market has been exhibiting a bullish trend in recent weeks. However, we have now noticed a retracement towards the lower end, which could indicate a correction phase. The initial reaction was in favor of the US dollar due to the Federal Reserve’s hawkish stance, but this has since faded away, Although the markets have largely ignored this data so far, there may be increased price volatility closer to the release of the NFP figure.
Try the Best Forex Signals Free Trial for 15 days No obligation cancel anytime.
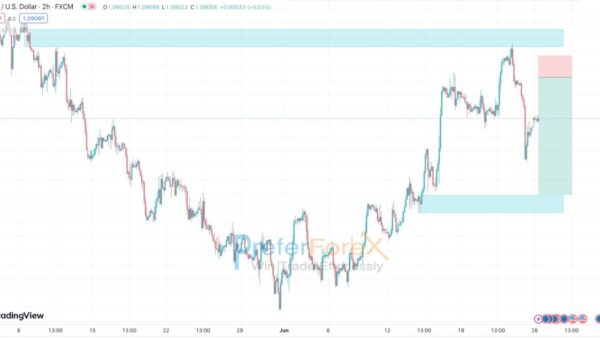
4-Hour Chart – Downtrend
Based on the analysis of the 4-hour chart, it appears that the market attempted to move in a bullish direction but was met with resistance and was unable to establish any significant bullish patterns. This suggests that there may be some remaining liquidity on the downside, meaning that the market could potentially continue to move in a bearish direction. It’s important to keep an eye on the market’s movements and patterns to gain a better understanding of its direction and potential future movements. Also, the market has broken its recent lower low which also indicates that the market will continue a bearish trend to take off liquidity from the left. Now, look on the left side, Here is an equal low pattern usually it’s a liquidity pool & Market may take off this liquidity.
See the Video To find details analysis and signals
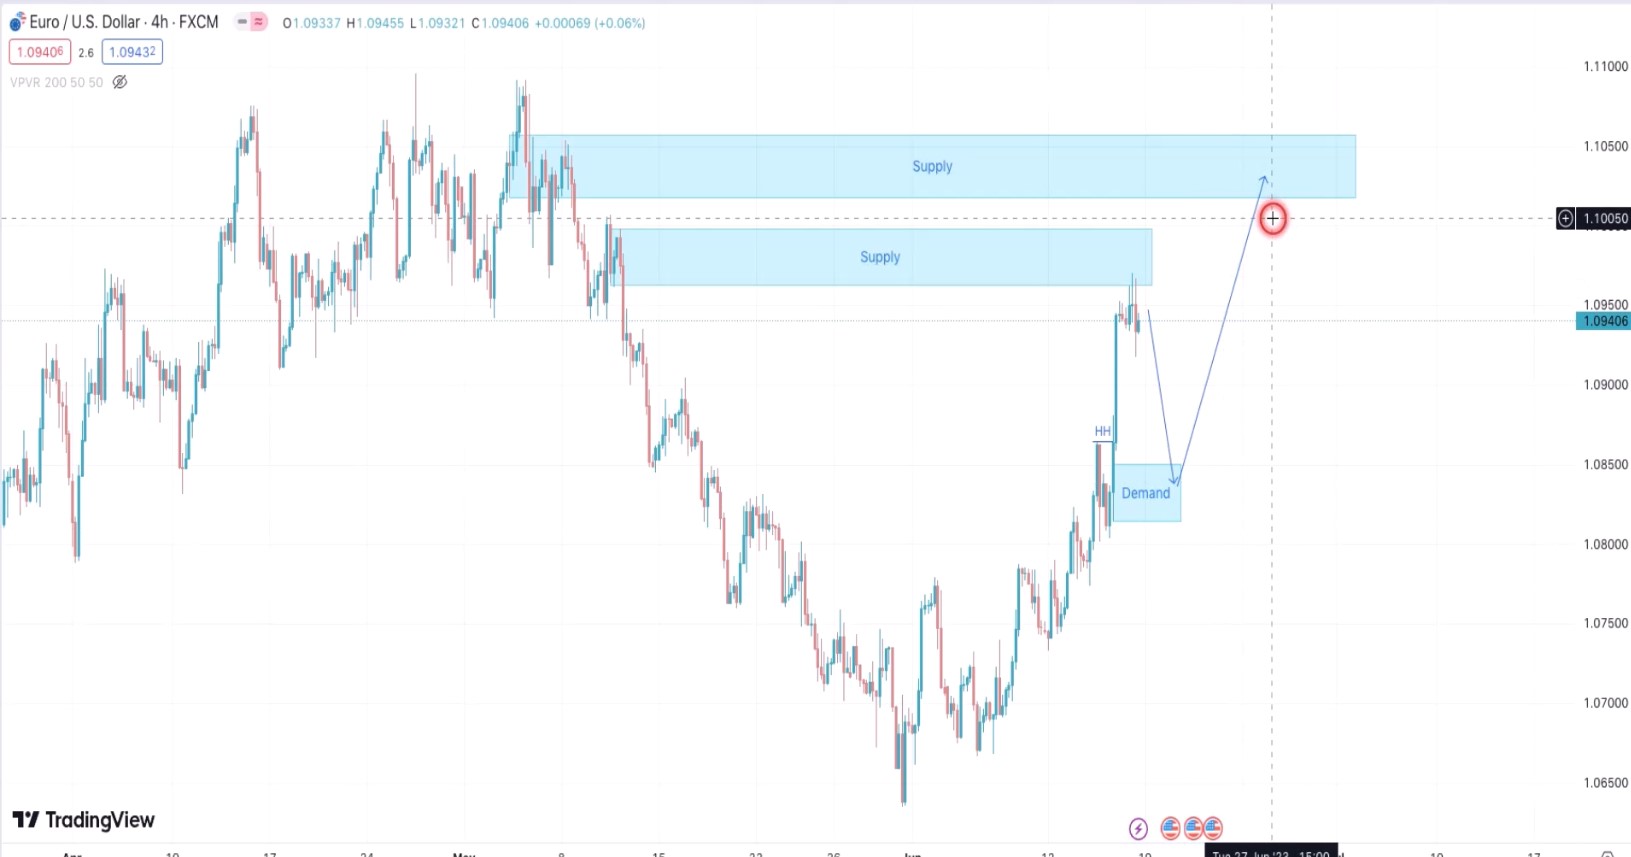
It is also considerable that below the liquidity pool there is also a demand zone, so most probably market will down to this demand area also.
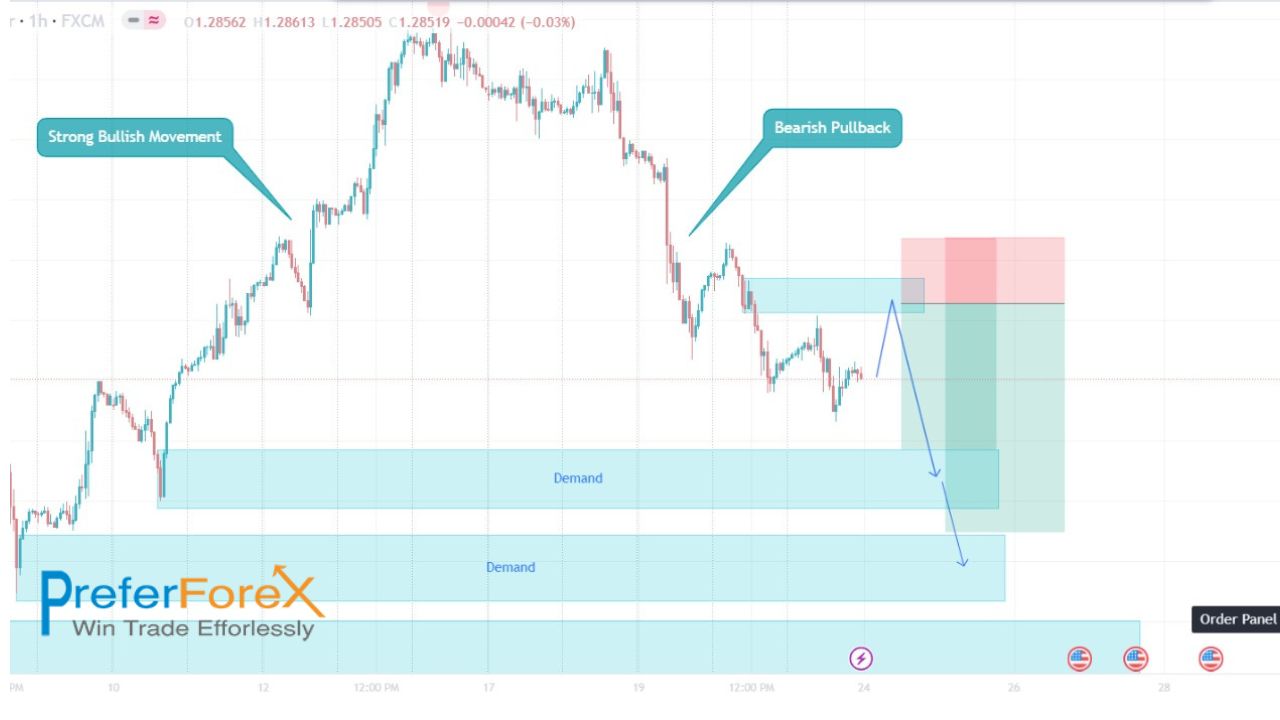
Micro Structure in 1 Hour chart
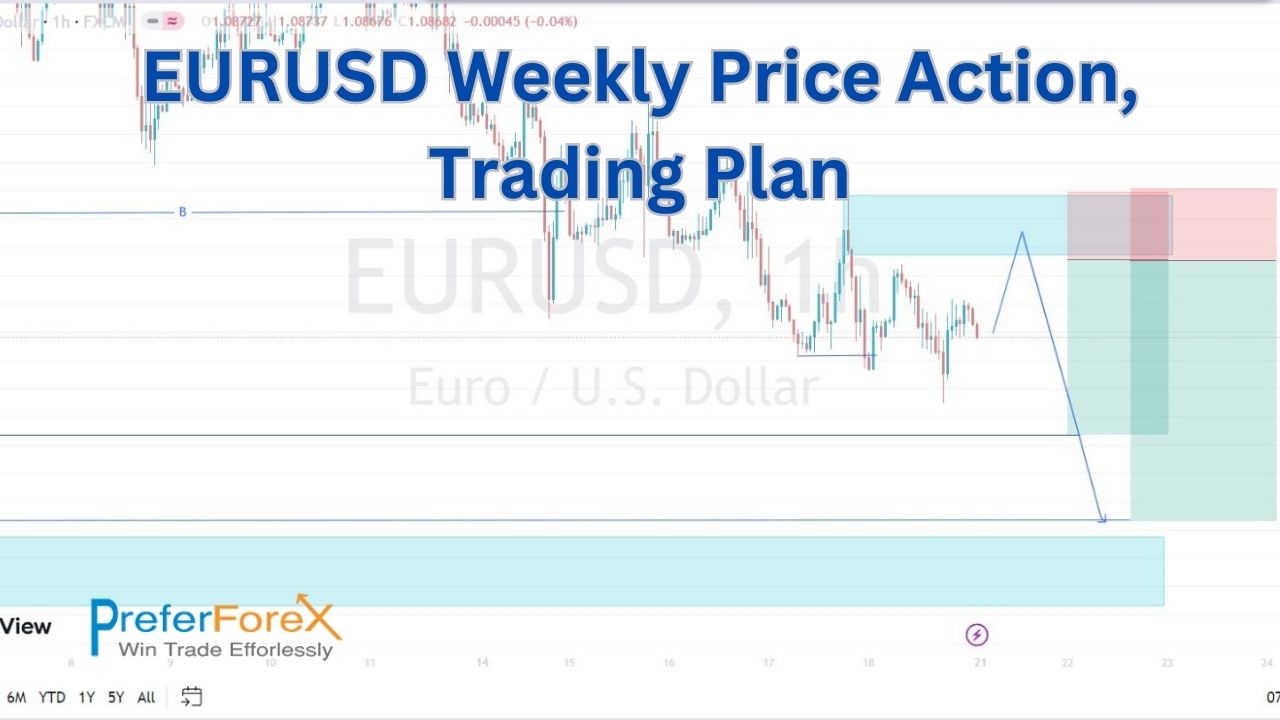
Looking at the 1-hour chart, it appears that the market has broken through the recent low. Additionally, there is a supply zone present which suggests that the market may attempt to mitigate this zone before continuing to move in a bearish direction. It’s important to keep in mind that while this zone may provide some temporary support, it’s not a guarantee that the market will reverse its trend. It’s important to continue monitoring the market’s movements and patterns to gain a better understanding of its direction and potential future movements.
Our Trading Plan for ERUSUSD
Finally, based on the analysis of the market, it seems that the trading plan is to enter into a short trade from the supply zone, provided that all other aspects are met. If this trade is executed, there will be two targets to consider. The first target will be the nearest liquidity pool, which is a level where there is a significant amount of buy orders and liquidity. The second target will be the demand zone, which is a level where there are a significant number of buy orders and demand for the asset. It’s important to keep an eye on the market’s movements and patterns to ensure that all other aspects of the trading plan are met before entering into a trade. Additionally, it’s important to have a solid risk management plan in place to minimize potential losses. [/vc_column_text][us_separator size=”large”][vc_column_text] Important Market Updates, Analysis, and Trading Plans Based on the market order flow Method in our YouTube Channel.
| https://www.youtube.com/@preferforex_official | |
| 🔔 Get Instantly Our Latest Forecast & Market Updates. | |
[/vc_column_text][/vc_column][vc_column sticky=”1″ link=”%7B%22url%22%3A%22%22%7D” width=”1/6″][vc_row_inner][vc_column_inner width=”1/1″][vc_column_text css=”%7B%22default%22%3A%7B%22padding-bottom%22%3A%2270px%22%7D%7D”]  [/vc_column_text][/vc_column_inner][/vc_row_inner][us_separator size=”large”][vc_column_text css=”%7B%22default%22%3A%7B%22background-color%22%3A%22rgba%280%2C121%2C250%2C0.34%29%22%2C%22padding-left%22%3A%2210px%22%2C%22padding-top%22%3A%2220px%22%2C%22padding-bottom%22%3A%2210px%22%2C%22padding-right%22%3A%2210px%22%2C%22border-radius%22%3A%225px%22%2C%22border-style%22%3A%22dashed%22%2C%22border-left-width%22%3A%222px%22%2C%22border-top-width%22%3A%222px%22%2C%22border-bottom-width%22%3A%222px%22%2C%22border-right-width%22%3A%222px%22%2C%22border-color%22%3A%22%231b98e0%22%7D%7D”]
Forex Signals Service
-
Exclusive Chart – To show various trading opportunity
-
Email Alert for Every signal and update Trade
-
WhatsApp Alert for signal and update
-
Trade Management Guideline
- Trade any broker.
- Full 15 Days FREE trial!
[/vc_column_text][/vc_column][/vc_row][vc_row height=”auto”][vc_column width=”1/1″][vc_column_text]
Recent Posts
[/vc_column_text][us_separator size=”small” show_line=”1″ line_width=”30″][vc_column_text]
- USDCAD Price Update: Bearish Setup Holds Near Failed Auction Zone
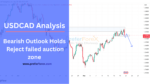 USDCAD is still respecting yesterday’s bearish failed auction view. Price is reacting near the 4H reaction zone, and a break below short-term demand can open downside targets.
 - USDCAD Analysis: Failed Auction Near Demand Zone
 USDCAD is accumulating near a key 4H demand zone after a possible failed auction. Roy’s analysis focuses on whether price can close below demand and open a bearish move toward lower liquidity.
 - AUDUSD Analysis: Bullish POI & Liquidity Sweep
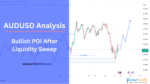 AUDUSD is trading near a bullish point of interest after sweeping short-term liquidity. If price holds the demand zone and confirms bullish order flow, the next focus stays on upside liquidity targets.
 - EEURUSD Analysis: Bearish Pressure Targets Bullish POI
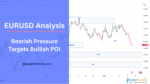 EURUSD remains under short-term bearish pressure after breaking 4H structure, but price is moving toward key bullish POI zones. This weekly analysis reviews the main liquidity areas, demand levels, bullish confirmation plan, invalidation level, and the Fed-related catalyst that can guide the next move.
 - EURUSD Analysis Today: Bullish POI in Focus After USD StrengthEUR/USD is trading near a key bullish POI after sweeping internal sell-side liquidity, but USD strength keeps pressure on the pair. Read the full breakdown to see the demand zone, confirmation plan, upside targets, and invalidation level
- Institutional Order Flow: How Smart Money Moves ForexInstitutional order flow explains how banks, funds, and large market participants move price through liquidity. This guide covers liquidity sweeps, order blocks, market structure, fair value gaps, POIs, and SMC-based trade planning.
[/vc_column_text][/vc_column][/vc_row][vc_row][vc_column us_bg_overlay_color=”rgba(0,0,0,0.50)” css=”%7B%22default%22%3A%7B%22color%22%3A%22%23ffffff%22%2C%22background-color%22%3A%22_content_secondary%22%2C%22background-image%22%3A%22https%3A%2F%2Fpreferforex.com%2Fwp-content%2Fplugins%2Fus-core%2Fassets%2Fimages%2Fplaceholder.svg%22%2C%22background-position%22%3A%220%2010%25%22%2C%22background-size%22%3A%22cover%22%2C%22padding-left%22%3A%228vh%22%2C%22padding-top%22%3A%228vh%22%2C%22padding-bottom%22%3A%227vh%22%2C%22padding-right%22%3A%228vh%22%2C%22border-radius%22%3A%2210px%22%7D%7D” width=”1/1″][us_cta title=”Start Learning Market Depth” color=”light” controls=”bottom” btn_label=”FREE Trial” btn_link=”url:https%3A%2F%2Fpreferforex.com%2Fforex-signals%2F” second_button=”1″ btn2_label=”Learn More” btn2_link=”url:https%3A%2F%2Fpreferforex.com%2Fforex-signals%2F” btn2_style=”4″ css=”%7B%22default%22%3A%7B%22background-color%22%3A%22_header_transparent_bg%22%2C%22padding-left%22%3A%220%22%2C%22padding-top%22%3A%220%22%2C%22padding-bottom%22%3A%220%22%2C%22padding-right%22%3A%220%22%7D%7D”] Be confident like Professional Trader, earn what you deserve. [/us_cta][/vc_column][/vc_row]


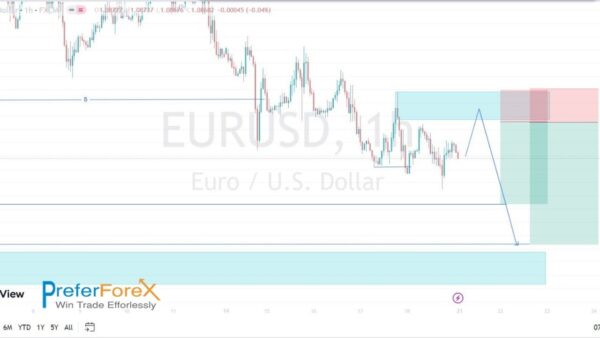
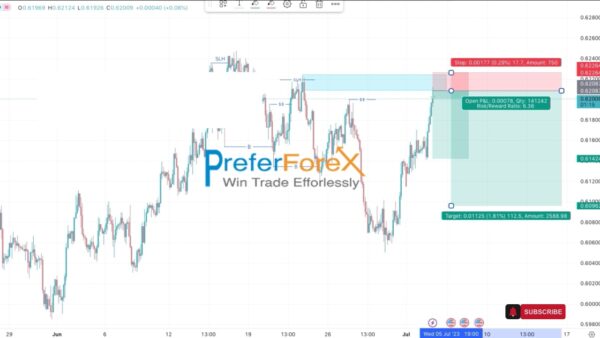 The pairs experienced a temporary uptrend. However, it’s crucial to recognize the presence of a nearby supply zone, which could act as a resistance area and potentially lead to a price reversal.
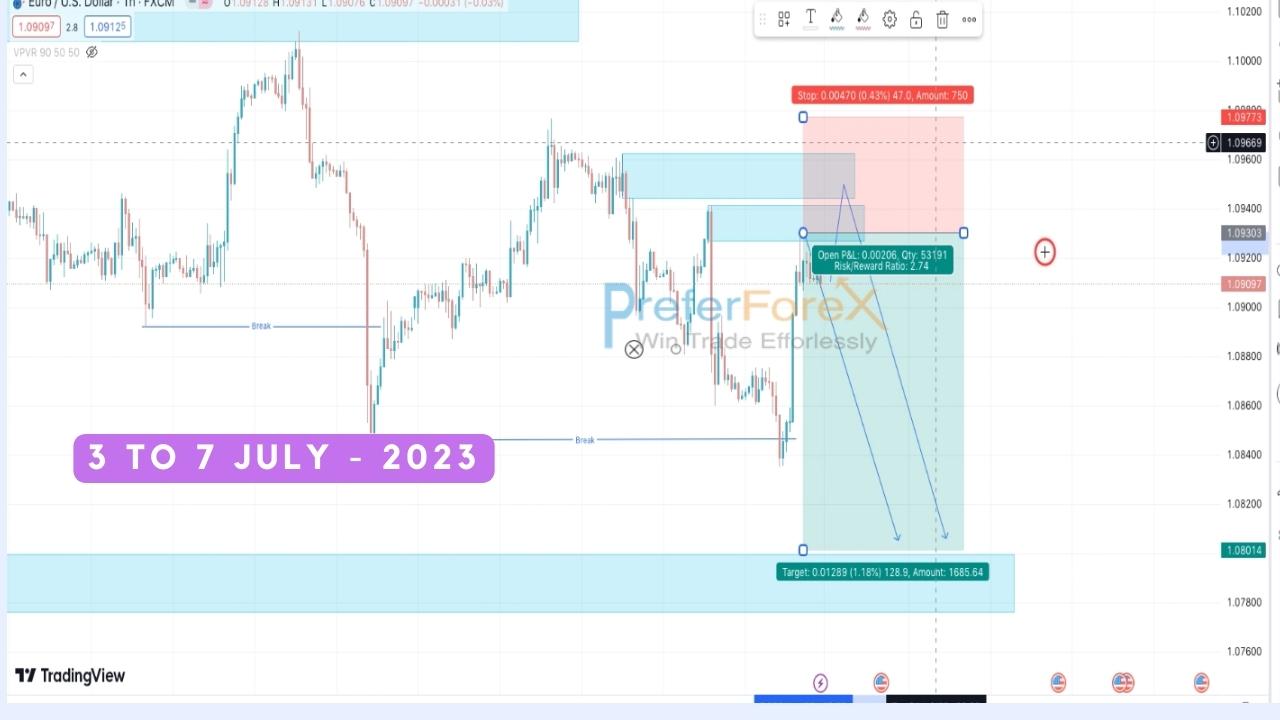

 And the sale trade target can be below the area shown in the video analysis.