
Institutional order flow is one of the most important concepts in professional forex trading. It explains how large financial institutions, banks, hedge funds, asset managers, and other major market participants create movement in the currency market.
For retail traders, learning institutional order flow helps shift the focus away from random entries and toward the real reason price moves: liquidity.
Most new traders ask, “Should I buy or sell?” A more experienced trader asks, “Where is price likely to collect liquidity before making the next move?”
Price rarely moves without a purpose. In many cases, it moves from one liquidity area to another, collecting orders before expanding in the next direction.
Institutional order flow is closely connected to Smart Money Concept, often called SMC. Both focus on market structure, liquidity sweeps, order blocks, displacement, fair value gaps, and points of interest. These concepts help traders understand why price reacts at certain zones, why breakouts fail, and why the market often reverses after taking obvious highs or lows.

Key Highlights – Institutional Order Flow
- Institutional order flow explains how banks, funds, and large market participants move price through liquidity.
- Forex price often moves toward buy-side or sell-side liquidity before reacting from key zones.
- Order blocks, fair value gaps, displacement, and market structure help traders read smart money activity.
- A strong order flow setup starts with higher-timeframe context, liquidity mapping, confirmation, and clear risk management.
What Is Institutional Order Flow?
Institutional order flow refers to the buying and selling activity created by large market participants. These participants include commercial banks, investment banks, hedge funds, pension funds, central banks, sovereign wealth funds, and multinational companies.
Their trades are much larger than normal retail trades, so they can have a strong effect on price movement. A retail trader can usually open or close a position without affecting the market. Institutions do not always have that advantage.
When a large fund or bank needs to buy or sell a huge amount of currency, it needs enough liquidity on the other side of the trade. Without enough liquidity, entering or exiting a large position becomes difficult and expensive.
Institutional order flow is not just about buying and selling. It is about where large orders can be filled.
Big players need counterparties. They need other traders’ orders to enter, reduce, hedge, or close positions. Those orders often sit around obvious highs, lows, support areas, resistance areas, and breakout levels.
According to the Bank for International Settlements, global OTC foreign exchange turnover averaged $9.6 trillion per day in April 2025. This shows the size of the forex market and why institutional activity plays such a major role in daily price movement.
Why Institutional Order Flow Matters
Institutional order flow matters because it gives traders a deeper reason for price movement. Instead of seeing every candle as random movement, traders learn to read the story behind the move.
They start to ask where liquidity is resting, which side of the market is being trapped, and where price may move next.
Forex is a decentralized market. Unlike some stock or futures markets, there is no single exchange where every trader can see the full order book. Retail traders do not have complete access to all institutional orders. However, price still leaves clues.
These clues appear through market structure, liquidity sweeps, displacement candles, order blocks, fair value gaps, and reactions from key zones.
For example, when EUR/USD rises above equal highs and then quickly reverses, many retail traders call it a failed breakout. An order flow trader sees something more specific. Price may have moved above those highs to trigger buy stops and short sellers’ stop losses. Once that buy-side liquidity is collected, the market may reverse if institutions use that liquidity to sell.
This does not mean every move is manipulation. It is better to think in terms of liquidity mechanics. Markets need orders to move.
Institutional Order Flow and Smart Money Concept
Smart Money Concept is a trading approach that studies how large market participants interact with liquidity. Institutional order flow is the logic behind many SMC ideas.
SMC traders look for signs that price has collected liquidity, changed structure, and started a new directional move.
The main SMC concepts include market structure, liquidity, order blocks, fair value gaps, break of structure, change of character, premium and discount zones, and points of interest.
These terms can sound complicated at first, but they all connect to a simple idea: price moves toward liquidity and reacts from important zones.
A bullish SMC scenario often starts when price sweeps sell-side liquidity below a previous low. After the sweep, price reacts from a demand zone or order block. Then price breaks a short-term high with strong displacement. This tells the trader that bearish liquidity was collected and bullish order flow may now be active.
A bearish SMC scenario is the opposite. Price may sweep buy-side liquidity above a previous high, reject from a supply zone, and then break a short-term low. This creates a possible bearish shift in order flow. The trader can then wait for price to retrace into a point of interest before looking for confirmation.
How Institutions Use Liquidity
Liquidity is the heart of institutional order flow. In simple terms, liquidity means available buy and sell orders in the market. The more liquidity a market has, the easier it is to execute larger orders without causing too much price movement.
In forex trading, liquidity often collects around obvious levels. These include old highs, old lows, equal highs, equal lows, previous daily highs, previous daily lows, session highs, session lows, and major support or resistance zones.
Retail traders often place stop losses and breakout orders around these levels.
- Buy-side liquidity usually rests above highs. This includes buy stop orders from breakout traders and stop losses from traders who are short.
- Sell-side liquidity usually rests below lows. This includes sell stop orders from breakout sellers and stop losses from traders who are long.
Institutions need liquidity because they trade size. If a large institution wants to sell, it needs buyers. A move above a previous high can create those buyers by triggering buy stops. If a large institution wants to buy, it needs sellers. A move below a previous low can create those sellers by triggering sell stops.
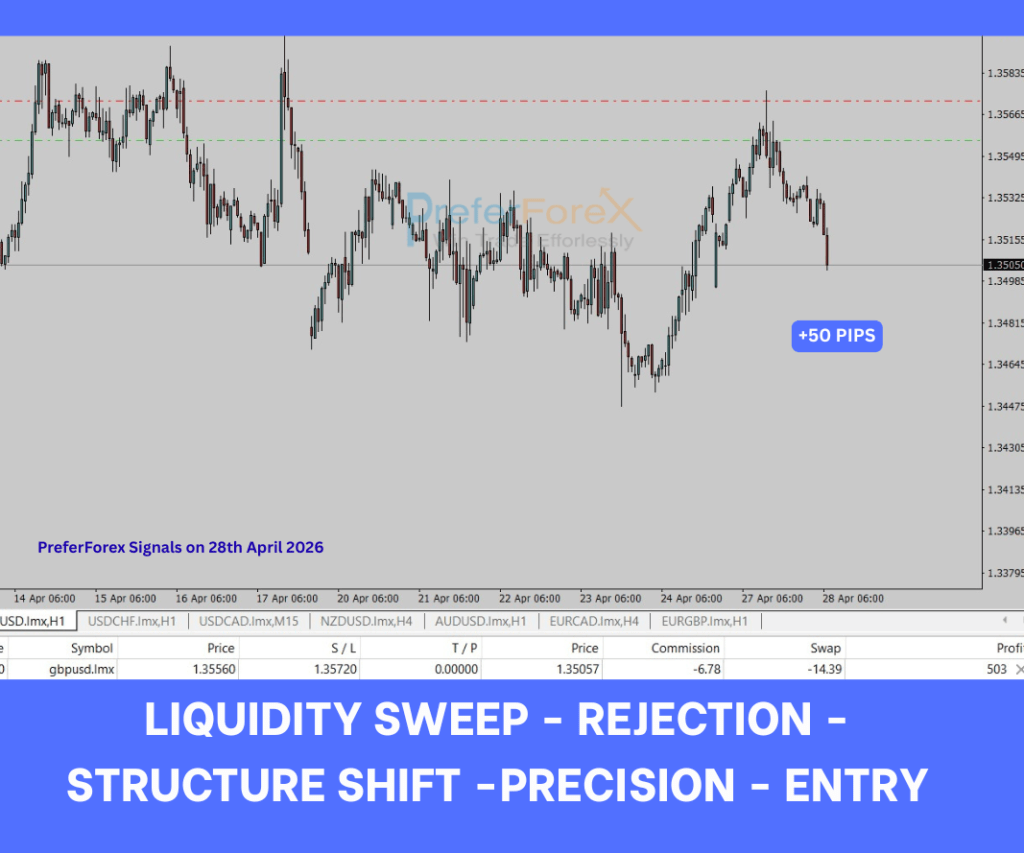
Buy-Side Liquidity and Sell-Side Liquidity
Buy-side liquidity and sell-side liquidity are two of the most useful ideas for understanding institutional order flow. They help traders identify where price may be drawn next.
Buy-side liquidity sits above price. It is usually found above swing highs, equal highs, resistance levels, and previous session highs. When price reaches these areas, buy stops can be triggered. This can create the liquidity needed for larger players to sell into.
Sell-side liquidity sits below price. It is usually found below swing lows, equal lows, support levels, and previous session lows. When price reaches these areas, sell stops can be triggered. This can create the liquidity needed for larger players to buy into.
A simple way to read the chart is to mark the most obvious highs and lows. Then ask which side of liquidity price is more likely to target.
A liquidity sweep becomes more useful when it is followed by rejection, displacement, and a clear structure shift.
Traders should not assume that every liquidity sweep causes a reversal. Sometimes price takes liquidity and continues in the same direction. This is why confirmation is important.
Market Structure: The Foundation of Order Flow
Market structure shows the direction and condition of price. It tells traders whether the market is trending, ranging, reversing, or consolidating. Without structure, liquidity zones can become confusing.
In a bullish structure, price creates higher highs and higher lows. Buyers are in control, and pullbacks often create buying opportunities. In a bearish structure, price creates lower lows and lower highs. Sellers are in control, and rallies often create selling opportunities.
A ranging market is different. Price moves between a high and a low without clear continuation. In these conditions, both buy-side and sell-side liquidity can be swept repeatedly. This is where many traders get trapped because they trade every breakout without waiting for confirmation.
Institutional order flow works best when traders combine liquidity with structure. For example, if the higher timeframe is bullish and price sweeps a short-term low into demand, that sweep may create a strong buying opportunity. But if the higher timeframe is bearish, the same sweep may only create a small pullback before price continues lower.
Break of Structure and Change of Character
Break of structure and change of character are two important order flow signals. They help traders identify when price is continuing or shifting direction.
A break of structure happens when price breaks a meaningful swing high or swing low in the direction of the current trend. In a bullish trend, a break above a previous swing high shows continuation. In a bearish trend, a break below a previous swing low shows continuation.
A change of character happens when price gives the first sign that the current short-term direction may be changing. For example, if price has been falling and then sweeps a low, reacts from demand, and breaks a minor high, that may signal a bullish change of character.
These signals are stronger when they happen after a liquidity event. A change of character in the middle of a messy range has less value. A change of character after a clean liquidity sweep and reaction from a higher-timeframe POI has more value.
Order Blocks in Institutional Order Flow
An order block is a price zone where significant buying or selling may have occurred before a strong move. In simple terms, it is often the last opposing candle before displacement.
A bullish order block usually forms before a strong upward move. A bearish order block usually forms before a strong downward move.
Traders use order blocks as potential points of interest. If price returns to an order block, it may react from that area because unfilled or defended orders may still exist there.
Not every candle is an order block. A strong order block should have context, liquidity, displacement, and structure behind it.
A stronger order block usually has several features. It appears near a liquidity sweep, it causes displacement, it breaks structure, and it aligns with the higher-timeframe direction. A weak order block appears in the middle of a range with no clear liquidity event or structure shift.
When using order blocks, traders should avoid overcrowding the chart. Marking too many zones creates confusion. The goal is to identify the cleanest POI that supports the main order flow idea.
Fair Value Gaps and Imbalance
A fair value gap, also called an imbalance, forms when price moves quickly and leaves an area with limited two-way trading. It usually appears during strong displacement.
Many SMC traders watch fair value gaps because price often returns to these areas before continuing in the main direction.
Fair value gaps can be useful, but they should not be traded alone. A fair value gap in the middle of a choppy range has less value. A fair value gap formed after a liquidity sweep, displacement, and structure break has stronger context.
In bullish order flow, price may sweep sell-side liquidity, create a strong bullish displacement, and leave a fair value gap behind. If price later retraces into the gap and holds, traders may look for bullish confirmation. In bearish order flow, price may sweep buy-side liquidity, move down with displacement, and return to a bearish imbalance before continuing lower.
Displacement: The Sign of Strong Order Flow
Displacement is a strong move away from a price area. It often appears as a large candle or a series of candles with little overlap.
In institutional order flow, displacement is important because it shows force. It suggests that one side of the market has taken control.
A liquidity sweep without displacement can be weak. Price may simply continue ranging. But a liquidity sweep followed by strong displacement gives a clearer message. It shows that liquidity was taken and the market reacted with strength.
Traders should pay attention to where displacement begins. The origin of the displacement move can become a useful POI. That area may later act as an order block, supply zone, or demand zone.
How to Read Institutional Order Flow Step by Step
Traders need a repeatable process. Without a process, institutional order flow can become complicated. The following steps give a simple way to read the market.
Step 1: Start With the Higher Timeframe
Begin with the daily or 4-hour chart. Mark the main swing highs and swing lows. Decide whether the market is bullish, bearish, or ranging. The higher timeframe gives the main context.
Step 2: Mark Liquidity
Mark buy-side liquidity above highs and sell-side liquidity below lows. Focus on the most obvious levels. Equal highs, equal lows, previous daily highs, previous daily lows, and major swing points are useful areas to watch.
Step 3: Wait for Liquidity to Be Taken
A strong setup often begins after liquidity is taken. Price may sweep a high or low and then return back into the range. This can show that breakout traders were trapped and stops were triggered.
Do not enter only because liquidity was swept. Wait for reaction, rejection, displacement, and structure confirmation.
Step 4: Look for Structure Shift
After the sweep, look for a break of structure or change of character. This gives confirmation that order flow may be shifting. In a bullish setup, price should break a short-term high. In a bearish setup, price should break a short-term low.
Step 5: Identify the POI
Mark the order block, supply or demand zone, or fair value gap that caused the displacement. This becomes the area where price may return before continuing.
Step 6: Wait for Entry Confirmation
When price retraces into the POI, look for lower-timeframe confirmation. This can include rejection, a minor structure shift, or a clean candle close away from the zone. This helps avoid entering too early.
Step 7: Define Risk and Target
Place the stop loss beyond the invalidation point, not at a random number of pips. In bullish setups, invalidation is often below the swept low or demand zone. In bearish setups, invalidation is often above the swept high or supply zone.
Targets should also be logical. Buy trades often target buy-side liquidity. Sell trades often target sell-side liquidity. This keeps the trade plan connected to the same order flow logic used for entry.
Bullish Institutional Order Flow Example
Imagine EUR/USD is bullish on the 4-hour chart. Price pulls back into a higher-timeframe demand zone and forms equal lows. Many retail traders see those equal lows as support. Buyers place stop losses below the lows, and breakout sellers place sell stop orders below the same area.
Price then drops below the equal lows. This triggers sell-side liquidity. At first, it looks bearish. But instead of continuing lower, price rejects strongly from the demand zone and closes back above the swept low.
On the lower timeframe, price breaks a minor high with displacement. This tells the trader that bearish liquidity was collected and bullish order flow may be active. The trader can now mark the bullish order block or fair value gap created by the displacement.
If price retraces into that POI and holds, a long setup may form. The stop loss can sit below the swept low, and the target can be placed near buy-side liquidity above the recent highs. This creates a structured trade plan based on liquidity, reaction, confirmation, and risk.
Bearish Institutional Order Flow Example
Now imagine GBP/USD is bearish on the 4-hour chart. Price rallies into a higher-timeframe supply zone and forms equal highs. Retail traders see those equal highs as resistance. Short sellers place stop losses above them, while breakout buyers place buy stop orders above the same level.
Price then pushes above the equal highs. This triggers buy-side liquidity. Many traders believe a bullish breakout has started. But price quickly rejects from the supply zone and moves back below the breakout level.
On the lower timeframe, price breaks a short-term low with strong bearish displacement. This shows a possible bearish shift in order flow. The trader can mark the bearish order block or imbalance that caused the move.
If price retraces into the POI and rejects, a sell setup may form. The stop loss can sit above the swept high, and the target can be placed near sell-side liquidity below the previous lows.
Best Timeframes for Institutional Order Flow Trading
Institutional order flow can be studied on many timeframes, but traders need a clear structure. Looking at too many charts creates confusion. A simple top-down approach works better.
The daily chart helps identify the major trend and important liquidity levels. The 4-hour chart helps refine swing structure and POIs. The 1-hour or 15-minute chart can help confirm direction and show cleaner entry areas.
Lower timeframes such as 5-minute or 1-minute charts can help refine entries, but they also contain more noise. Beginners should avoid starting only on very low timeframes. A 1-minute chart can look exciting, but it often creates emotional decisions.
Risk Management in Order Flow Trading
Institutional order flow can improve analysis, but it does not remove risk. No setup is guaranteed. A clean liquidity sweep, strong displacement, and perfect POI can still fail. This is why risk management is part of the strategy, not an optional extra.
Traders should decide the risk before entering. Many traders risk too much because a setup looks obvious. That is dangerous. A professional approach keeps risk consistent.
The stop loss should be placed beyond the logical invalidation point, and the position size should match the distance between entry and stop.
A good trade should also have a clear target. If the target is too close and the stop is too wide, the trade has poor reward potential. If the target is unrealistic, the trader may hold too long and give back profit.
Order flow traders often use liquidity as the target because liquidity gives price a logical destination.
How PreferForex Uses Institutional Order Flow
PreferForex uses institutional order flow to build cleaner forex market analysis. Instead of relying on too many indicators, we focus on market structure, liquidity, POI zones, order blocks, and directional bias.
This helps traders understand why price is moving and where the next trading opportunity may appear.
Traders who want structured market direction can visit our forex signals page. It gives access to trade ideas and market guidance designed around disciplined analysis and risk-focused planning.
Traders who want to learn the full SMC logic behind liquidity, order blocks, market structure, and institutional order flow can also explore our Smart Money Trading mentorship. Learning the logic behind the setup is important because it helps traders understand the chart instead of simply copying entries.
Institutional Order Flow Checklist
Use this checklist before taking an order flow-based trade:
- What is the higher-timeframe direction?
- Is the market trending, ranging, or reversing?
- Where is buy-side liquidity?
- Where is sell-side liquidity?
- Has price swept a major high or low?
- Did price react with clear displacement?
- Did price break structure or show a change of character?
- Is there a clean order block, POI, or fair value gap?
- Does the lower timeframe confirm the idea?
- Where is the invalidation level?
- Where is the logical liquidity-based target?
- Is the risk-to-reward ratio acceptable?
- Is there major news that can affect the trade?
This checklist helps traders slow down. The goal is not to find more trades. The goal is to find better trade conditions with a clear reason behind each decision.
Is Institutional Order Flow Good for Beginners?
Institutional order flow is useful for beginners, but it takes time to learn. Many new traders want simple buy and sell signals. Order flow trading requires more patience because it asks traders to read the full market story.
Beginners should start with market structure. Learn how to identify higher highs, higher lows, lower highs, and lower lows. After that, study liquidity. Learn where stops and breakout orders are likely resting. Then move into order blocks, fair value gaps, displacement, and POIs.
Trying to learn every SMC term at once creates confusion. A clean chart with structure and liquidity is better than a chart full of labels.
Final Thoughts
Institutional order flow gives forex traders a better way to understand market movement. It shows why price often sweeps highs and lows, why breakouts fail, why strong moves begin from certain zones, and why liquidity is central to the forex market.
Retail traders cannot see every institutional order. But they can learn to read the footprints left on the chart. Liquidity pools, market structure shifts, displacement candles, order blocks, fair value gaps, and POI reactions all provide useful clues.
A strong trader does not chase every candle. A strong trader waits for context, confirmation, and proper risk. Institutional order flow helps create that discipline. When used with a trading plan and risk management, it gives traders a more professional way to approach the forex market.