
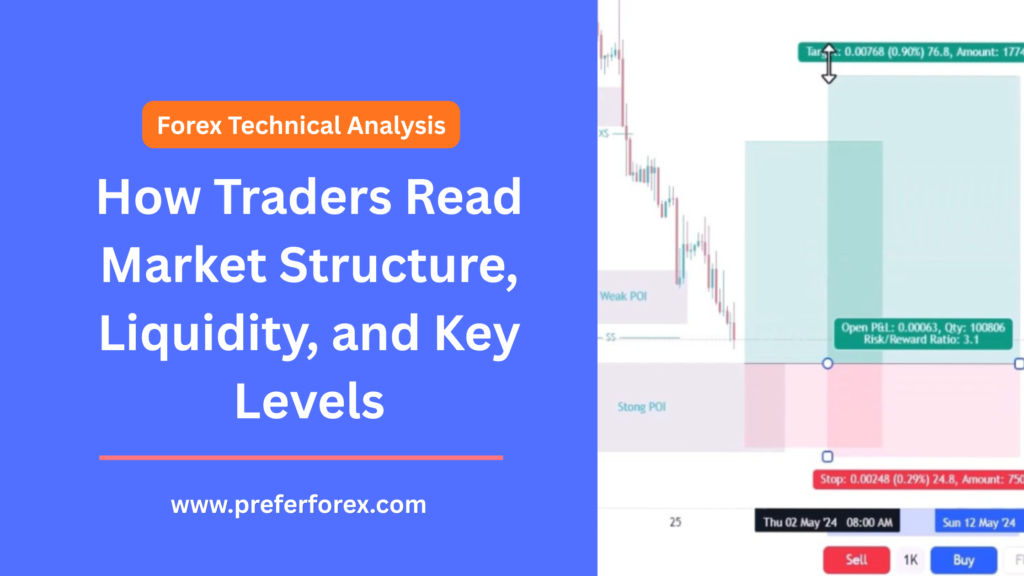
Forex technical analysis is not about predicting every candle. It is about building a structured plan before price reaches an important level.
What Is Forex Technical Analysis?
Forex technical analysis is the study of currency price movement through charts. It uses past and current price behavior to understand market direction, structure, liquidity, and possible reaction zones. Traders use this information to decide where a setup is valid, where risk should be placed, and where price may target next. The purpose is not to know the future with certainty. No trader can do that. The purpose is to create a structured view of the market. A good technical analysis plan helps a trader avoid emotional entries and wait for price to reach a meaningful area. A basic forex technical analysis plan should answer five important questions:- Direction: Is the market bullish, bearish, or ranging?
- Structure: Is price forming higher highs and higher lows, or lower highs and lower lows?
- Liquidity: Where are stop losses and breakout orders likely resting?
- Key level: Where can price react, reject, or continue?
- Risk: Where is the trade idea wrong?
Why Forex Traders Use Technical Analysis
Forex traders use technical analysis because currency prices move through structure. Price does not travel in one straight line for long. It pushes, pulls back, consolidates, sweeps highs or lows, and reacts around important zones. Technical analysis helps traders organize that movement. Without a chart plan, a trader can easily buy after price has already reached resistance or sell after price has already swept a major low. The chart gives context before emotion takes control. Traders also use technical analysis to plan risk. A clean setup must have a clear invalidation level. If a trader buys from a demand or POI zone, the invalidation is usually below the zone or below the low that supports the idea. If a trader sells from supply, the invalidation often sits above the supply area or above the swing high. Technical analysis also helps separate a real trade idea from a random entry. A trader can say, “If price sweeps sell-side liquidity and reclaims the level, I will look for bullish confirmation.” That is different from saying, “I think price will go up.” A chart does not tell traders what to feel. It shows where price has reacted before and where traders may react again.Main Parts of Forex Technical Analysis
A complete forex technical analysis process includes more than one tool. Some traders use moving averages, RSI, MACD, or trendlines. Others focus mostly on price action, liquidity, and market structure. The best approach is not about using many tools. It is about understanding what each part tells you.Trend Direction
Trend direction shows the general path of price. In a bullish trend, price usually creates higher highs and higher lows. In a bearish trend, price usually creates lower highs and lower lows. In a range, price moves between a high area and a low area without clear continuation. Trend matters because trading against the larger direction usually needs stronger confirmation. A bullish setup is cleaner when the higher time frame also supports higher prices. A bearish setup is cleaner when the higher time frame supports lower prices.Market Structure
Market structure is the pattern created by swing highs and swing lows. It tells traders whether price is building continuation, creating a pullback, or showing early signs of reversal. A break of structure happens when price breaks an important swing point in the direction of the trend. A change of character happens when price starts breaking the opposite side of the previous structure. Traders use these shifts to understand when momentum is changing.Support and Resistance
Support is a price area where buyers have reacted before. Resistance is a price area where sellers have reacted before. These zones are simple, but they remain useful because many traders watch the same areas. Support and resistance should not be treated as exact lines. Price often moves slightly above or below a level before reacting. That is why zones are usually more useful than thin horizontal lines.Liquidity Zones
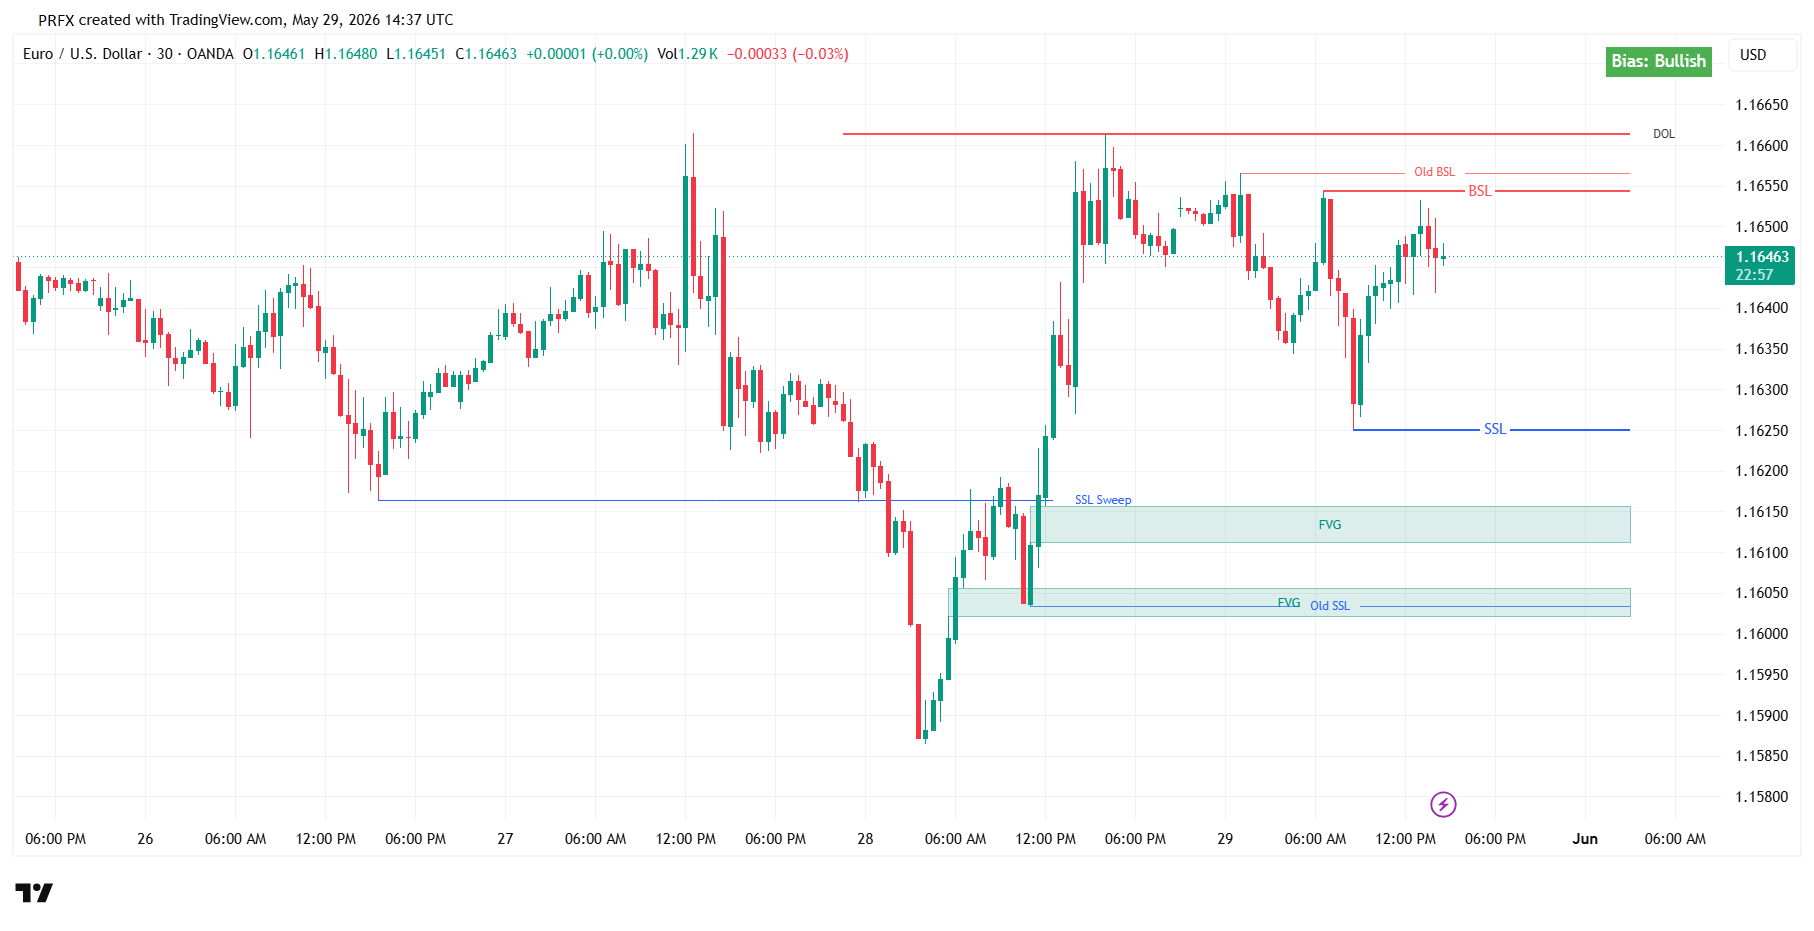
Liquidity zones are areas where orders are likely resting. Buy-side liquidity often sits above previous highs, equal highs, or obvious resistance. Sell-side liquidity often sits below previous lows, equal lows, or obvious support. Price often moves toward these areas because stop losses and breakout orders create available liquidity. A liquidity sweep happens when price moves through a high or low, collects orders, and then returns back into the previous range.Points of Interest
A point of interest, often called a POI, is a zone where traders expect price to react. It can be a demand zone, supply zone, order block, imbalance area, volume level, or previous reaction zone. A POI is not a blind entry. It is a location where traders wait for reaction, confirmation, and invalidation. The zone gives the trader a place to focus, but the trade still needs a plan.Market Structure in Forex Technical Analysis
Market structure is one of the most important parts of forex technical analysis. It shows how price is building movement across time. When traders understand structure, they stop seeing random candles and start seeing organized price behavior. In an uptrend, price creates higher highs and higher lows. The higher highs show buying pressure. The higher lows show that sellers are failing to push price deeply enough to change the trend. As long as this structure holds, traders usually give more weight to bullish setups. In a downtrend, price creates lower lows and lower highs. The lower lows show selling pressure. The lower highs show that buyers cannot push price above previous reaction points. In that environment, bearish setups often carry more weight. Structure also exists inside structure. A 4H chart may show a bullish trend while the 15-minute chart shows a bearish pullback. That does not always mean the larger trend has changed. It may only mean price is correcting into a higher-time-frame POI. This is why traders separate external structure from internal structure. External structure shows the larger swing path. Internal structure shows the smaller movements inside that path. A good trader studies both before deciding whether a setup is continuation, pullback, or reversal. In practice, market structure tells traders whether price is building continuation or preparing for a deeper pullback. It also helps traders avoid entering at poor locations. Buying after price has already reached a major high is different from buying after price has swept sell-side liquidity and reclaimed a clean level.Liquidity: The Part Many Beginners Miss
Liquidity is one of the most misunderstood parts of forex technical analysis. Many beginners learn support and resistance first. They see a previous high and expect price to fall immediately. They see a previous low and expect price to bounce immediately. The market often behaves differently. Previous highs and lows are not only reaction points. They are also liquidity pools. Traders place stop losses above highs and below lows. Breakout traders place buy orders above resistance and sell orders below support. This creates order flow around obvious levels. Buy-side liquidity usually rests above:- Previous swing highs
- Equal highs
- Range highs
- Session highs
- Obvious resistance zones
- Previous swing lows
- Equal lows
- Range lows
- Session lows
- Obvious support zones
Institutional Order Flow and Forex Technical Analysis
Institutional order flow refers to the buying and selling activity created by banks, funds, liquidity providers, and other large market participants. Retail traders do not see the full institutional order book in the spot forex market, but they can still study how price behaves around liquidity, structure, and high-interest zones. This is where technical analysis becomes more useful than simple line drawing. If price repeatedly reacts from a level, sweeps liquidity before moving, or creates strong displacement after tapping a zone, traders can study those clues as part of order-flow reading. Institutional-style analysis does not mean guessing what banks are doing. It means reading price behavior with a focus on liquidity, execution areas, and market structure. A trader watches where price collects orders, where it rejects, and where it accepts or fails to accept a new level. For a deeper explanation of this concept, read our guide on institutional order flow. It connects closely with liquidity sweeps, POI zones, and smart money style chart reading.Key Levels Traders Watch
Key levels are price areas where traders expect reaction. These levels become important because price has reacted there before or because many orders are likely sitting nearby. Common forex key levels include:- Previous day high and low: These levels often attract intraday liquidity.
- Weekly high and low: These levels help traders understand broader market range.
- Swing highs and lows: These points show structure and possible liquidity pools.
- Session highs and lows: London and New York session levels often matter for intraday traders.
- Support and resistance zones: These areas show previous buying or selling reaction.
- POI zones: These are areas where traders wait for price reaction and confirmation.
- Volume profile levels: These levels can show where more trading activity occurred.

Indicators vs Price Action
Indicators can help traders, but they should not replace price action. A moving average can show trend direction. RSI can show momentum conditions. MACD can show momentum shifts. ATR can help measure volatility. These tools are useful when they support the chart context. The problem starts when traders use indicators as the full strategy. A buy signal from one indicator does not mean the trade has a good location. A sell signal does not mean price has reached a strong liquidity zone. An indicator can react late, especially after a strong move. Price action gives the first layer of context. It shows where price broke structure, where liquidity was swept, where a wick rejected, and where the candle closed. Indicators can then support the idea, but they should not lead the full decision. For example, if price sweeps sell-side liquidity into a demand zone and then reclaims the broken low, that is useful price information. If momentum also starts turning upward, the indicator supports the idea. But the main reason remains the price reaction at the correct level. This is why many experienced traders keep their charts clean. They use fewer tools, but they understand each tool better.How to Build a Forex Technical Analysis Plan
A trading plan turns chart reading into a clear process. Without a process, technical analysis can become random. Traders may draw lines after price moves, switch bias too quickly, or take trades without knowing where the idea fails. A practical forex technical analysis plan can follow these steps:1. Start With the Higher-Time-Frame Direction
Begin with the daily, 4H, or 1H chart depending on your trading style. Mark whether price is bullish, bearish, or ranging. Do not start on the lowest time frame first, because small candles can hide the larger market direction.2. Mark Major Swing Highs and Lows
Swing highs and lows show structure. They also show where liquidity may sit. Mark only the important highs and lows that define the current range or trend. Avoid filling the chart with old levels that no longer matter.3. Identify Buy-Side and Sell-Side Liquidity
Look above highs for buy-side liquidity and below lows for sell-side liquidity. Ask where breakout traders may enter and where stop losses may sit. These areas often become targets before a larger reaction.4. Mark Support, Resistance, and POI Zones
After marking liquidity, identify zones where price can react. This can include support, resistance, supply, demand, imbalance, order block, or volume profile levels. A good POI should have a clear reason for being on the chart.5. Wait for Price Reaction or Confirmation
A level alone is not a trade. Wait for price to show reaction. Confirmation can include a reclaim after a sweep, a strong candle close, a market structure shift, or a smaller-time-frame setup that supports the higher-time-frame idea.6. Define Invalidation
Every trade idea needs a point where it is wrong. If a bullish setup depends on a demand zone holding, then a clean break below that zone may invalidate the idea. If a bearish setup depends on supply holding, then a break above supply may invalidate the setup.7. Plan the Target and Risk-Reward
Targets should come from structure and liquidity, not hope. A bullish target may be the next buy-side liquidity above a prior high. A bearish target may be sell-side liquidity below a previous low. The risk-reward should make sense before entry, not after the trade is open. This planning habit is especially important for funded account traders. Prop firm traders need clean setups, controlled risk, and repeatable decision-making. You can read our guide on how to be a successful prop trader to understand how discipline, risk limits, and trade selection work together. This process keeps analysis disciplined. It also helps traders avoid chasing price after the best entry area has already passed.Example: Reading a Forex Chart Step by Step
Here is a simple example of how a trader may read a forex chart using market structure, liquidity, and key levels. Assume EURUSD is bullish on the 4H chart. Price has created higher highs and higher lows. The most recent high sits above the current market as buy-side liquidity. A recent internal low sits below the current price as sell-side liquidity. Below that low, there is a clean demand zone that caused a strong bullish move earlier. In this situation, a trader does not need to buy immediately. A cleaner plan is to wait. If price pulls back, sweeps the internal sell-side liquidity, taps the demand zone, and then reclaims the broken low, the trader has more information. The sweep shows that liquidity was collected. The reaction from demand shows that buyers may be defending the zone. The reclaim shows that price did not accept lower levels. If a lower-time-frame structure shift appears after that, the trader can plan a bullish idea with invalidation below the demand zone. The target would not be random. The first target may be a recent minor high. The larger target may be the buy-side liquidity above the previous 4H high. This gives the trade a logical path from sell-side liquidity into buy-side liquidity. The same logic can work in reverse for bearish setups. If price sweeps buy-side liquidity above a high, rejects from a supply zone, and returns below the broken high, traders may look for bearish continuation toward sell-side liquidity.Common Mistakes in Forex Technical Analysis
Technical analysis becomes weaker when traders use it without discipline. Many mistakes come from rushing, over-marking charts, or treating every level as a trade. Common mistakes include:- Drawing too many levels: A crowded chart makes decision-making harder.
- Ignoring higher-time-frame structure: Small-time-frame signals can fail against larger direction.
- Entering before confirmation: A POI gives a location, not automatic permission to trade.
- Treating every sweep as reversal: Some sweeps become real breakouts.
- Using indicators without structure: Indicator signals are weaker without chart context.
- Moving stop loss emotionally: Invalidation should be planned before entry.
- Ignoring news volatility: High-impact news can distort normal technical behavior.
Forex Technical Analysis vs Forex Signals
Forex technical analysis and forex signals are related, but they are not the same thing. A signal usually gives direct trade information such as entry, stop loss, and take profit. Technical analysis explains why a setup matters and how the market idea is built. A trader who only follows signals may know where to enter, but not why the level matters. A trader who understands technical analysis can read market structure, liquidity, and invalidation. This helps them make better decisions when price behaves differently than expected. Technical analysis also helps traders prepare multiple scenarios. For example, if price holds a POI, the bullish scenario remains active. If price breaks and accepts below that zone, the idea may be invalid. This type of planning is more flexible than blindly expecting one outcome. Signals can be useful when they are structured and risk-managed. But analysis gives the trader context behind the signal. In the long run, understanding context is what helps traders improve.Is Forex Technical Analysis Reliable?
Forex technical analysis is reliable as a planning tool, not as a guarantee. It helps traders identify structure, liquidity, key levels, risk areas, and possible targets. It does not remove uncertainty from the market. The reliability of technical analysis depends on how it is used. A trader who marks random support and resistance lines without structure will get poor results. A trader who combines higher-time-frame bias, liquidity, POI zones, confirmation, and risk management has a stronger process. Market conditions also matter. Technical analysis often works better in clean trending or well-structured ranging markets. It can become harder during high-impact news, low-liquidity sessions, or sudden geopolitical events. This is why risk management remains essential. Even a strong technical setup can fail. The trader’s job is not to avoid every loss. The trader’s job is to keep losses controlled and take only setups where the potential reward justifies the risk.Best Technical Analysis Method for Forex
The best technical analysis method for forex combines several practical elements instead of relying on one tool. A strong method usually includes market structure, liquidity, key levels, confirmation, and risk management. Market structure gives direction. Liquidity shows where price may be drawn. Key levels show where price may react. Confirmation helps avoid blind entries. Risk management keeps the trader protected when the setup fails. Indicators can support this process, but they should not replace it. A moving average can help define trend. RSI can help show momentum. Volume profile can help identify active price areas. But the core decision should still come from price location and structure. A trader does not need a complicated system. A simple process repeated consistently is more useful than a complex chart that changes every week.FAQs About Forex Technical Analysis
What is forex technical analysis?
Forex technical analysis is the study of currency price charts to understand trend direction, market structure, liquidity, support and resistance, key levels, and possible trade setups. Traders use it to plan entries, stop loss, take profit, and invalidation before entering a trade.Do forex traders need indicators?
Forex traders do not need many indicators. Indicators can help confirm trend, momentum, or volatility, but price action and market structure should lead the analysis. A clean chart with strong structure is usually better than a chart filled with too many tools.What is liquidity in forex technical analysis?
Liquidity refers to areas where orders are likely resting. Buy-side liquidity often sits above previous highs, while sell-side liquidity often sits below previous lows. Price may sweep these areas before reversing or continuing in the same direction.Is technical analysis enough for forex trading?
Technical analysis is important, but it should be combined with risk management, awareness of news events, and disciplined trade execution. A strong chart setup can still fail, so every trade needs a clear stop loss and invalidation point.What time frame is best for forex technical analysis?
The best time frame depends on the trader’s style. Swing traders often use daily and 4H charts. Intraday traders often use 4H, 1H, 15-minute, and 5-minute charts. The higher time frame gives direction, while the lower time frame helps refine entries.Final Thoughts
Forex technical analysis works best when traders use it as a planning framework. The chart should help traders understand structure, liquidity, key levels, confirmation, and risk. It should not become a place for guessing or reacting emotionally. A strong analysis starts with higher-time-frame direction, then moves into swing points, liquidity pools, POI zones, and invalidation levels. When these parts align, the trader has a clearer market plan. The most useful technical analysis is simple, structured, and repeatable. Traders do not need to predict every move. They need to know where the opportunity is, where the idea fails, and whether the reward is worth the risk.Editorial Note: This article was prepared by the PreferForex team as part of our forex education content. It explains forex technical analysis, market structure, liquidity zones, POI planning, institutional order flow, key levels, chart confirmation, and risk-focused trade planning.
Risk Disclaimer: Forex trading involves risk and can result in financial loss, especially when leverage is used. This article is for educational purposes only and does not constitute financial advice, investment advice, or a guarantee of trading results. Always trade with proper risk management.