EUR-USD is trading around the demand zone with a weak bearish trend
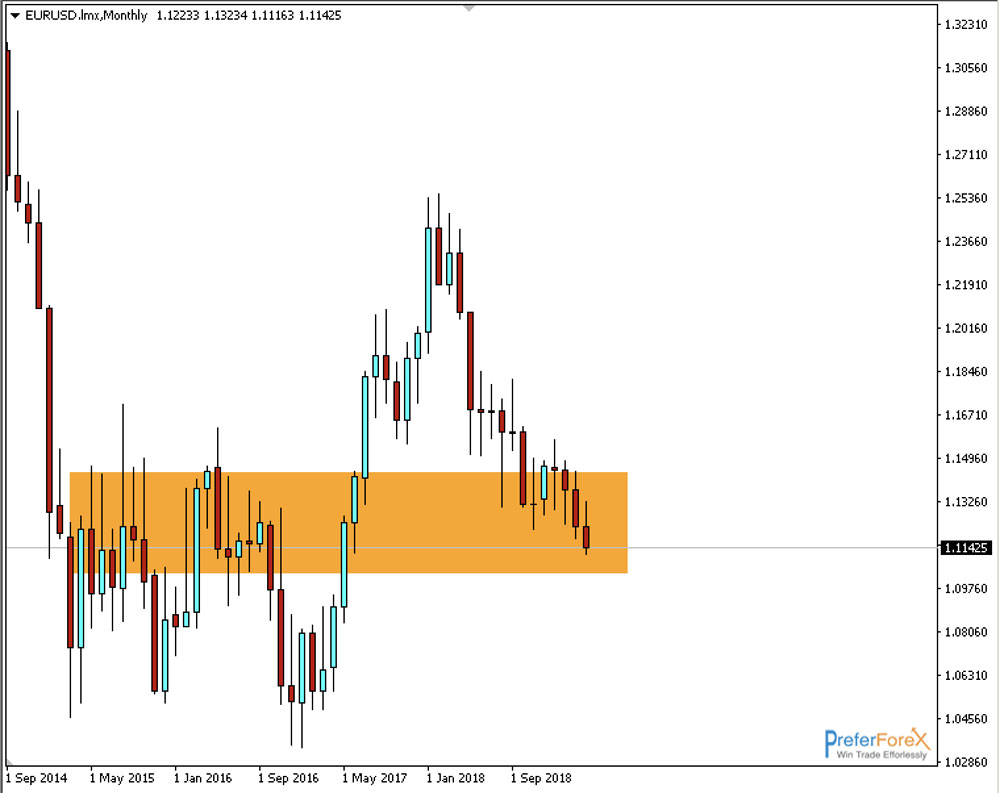
According to the monthly view, EURUSD fell to almost 2 year low and broke the support and is now retesting the area. In the chart below, the area marked with the orange rectangle is offering a big demand zone. If we observe the price closely from the last several weeks, the pair is trading around this zone by maintaining a weak bearish bias that is indicating the end of the bearish movement.
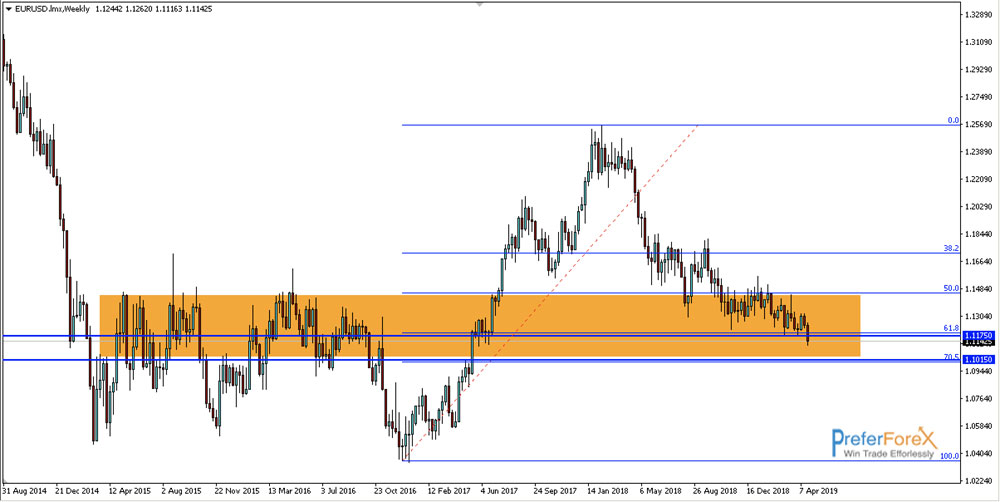
On the weekly view, the pair broke the recent low at 1.1175 and is trading below it, historically this is significant because it is now trading at the level which is 22 months lowest since June 2017.
The Fibonacci level indicates the price is ahead of the 70.5% level. It broke 61.8% on Wednesday 24th April and is now heading towards the 70.5% level. This fib level at 1.1015 also offers a support area for the price that the price may test.
Though the bias is still bearish we need to observe how the price reacts in this week to see if the bearish is becoming strong again or not to take further trading the decision as there are some influencing faces that can initiate bullish movement.
On the Fundamental view, this week is also important because there are EU inflation and GDP for the Eurozone and for the USA the FOMC and NPF events will happen and those facts may also indicate further strength of the USD currency.