EURUSD Technical & Fundamental View For the This Week
27th May to 31st May -2019
27th May to 31st May -2019
The week that we passed is completely a bull controlled week.
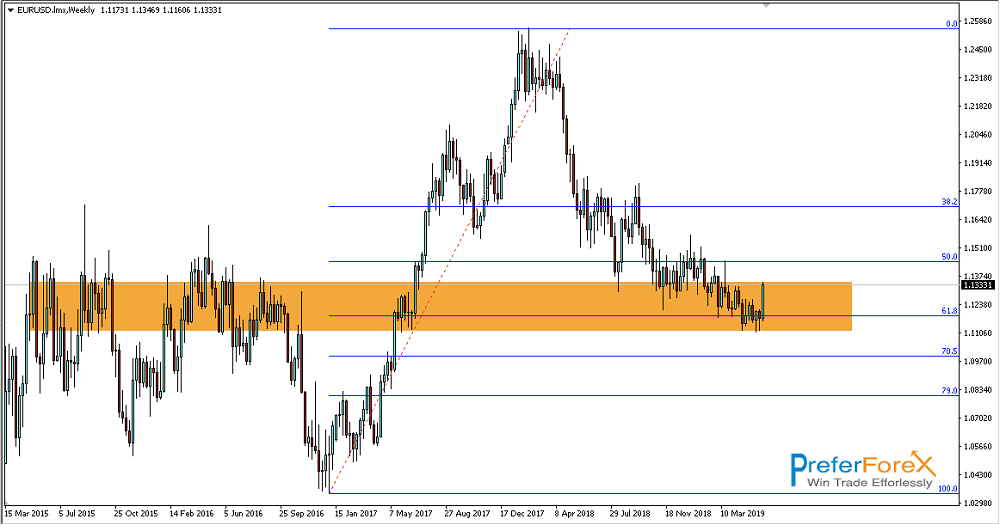
According to the weekly, the recent trading zone of EURUSD is supported by a strong demand area and Fibonacci 61.8% level, we have mentioned in the earlier analysis that the recent trading zone of this pair can initiate the bullish movement.
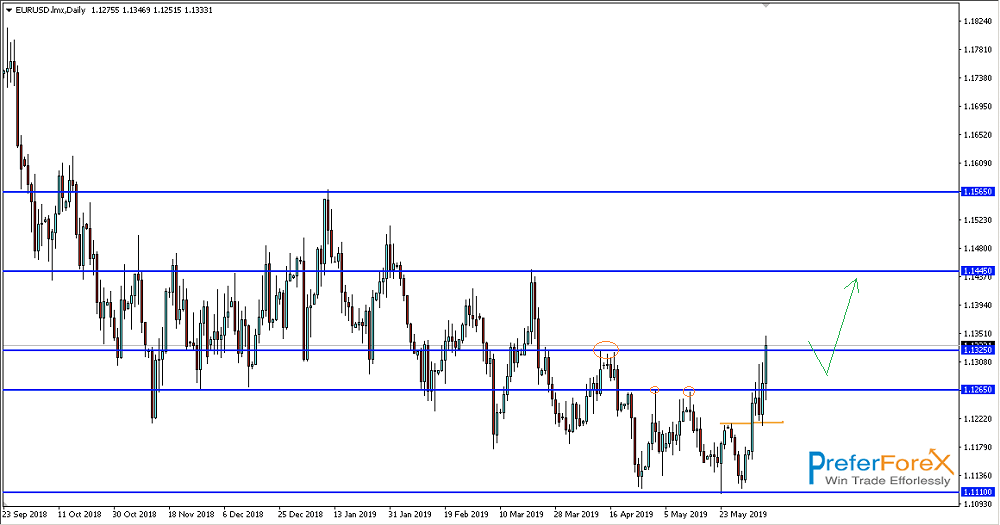
According to the daily view, the price breaks several resistance levels at a time. It breaks the recent high at 1.1265 and then the resistance level 1.1325 successfully. The nearer supply area is 1.14450 and now the price is heading towards this area. After breaking the area of 1.14450, we can expect the next target level is 1.1565. But a beak of the recent low at 1.1110, can invalid this scenario.
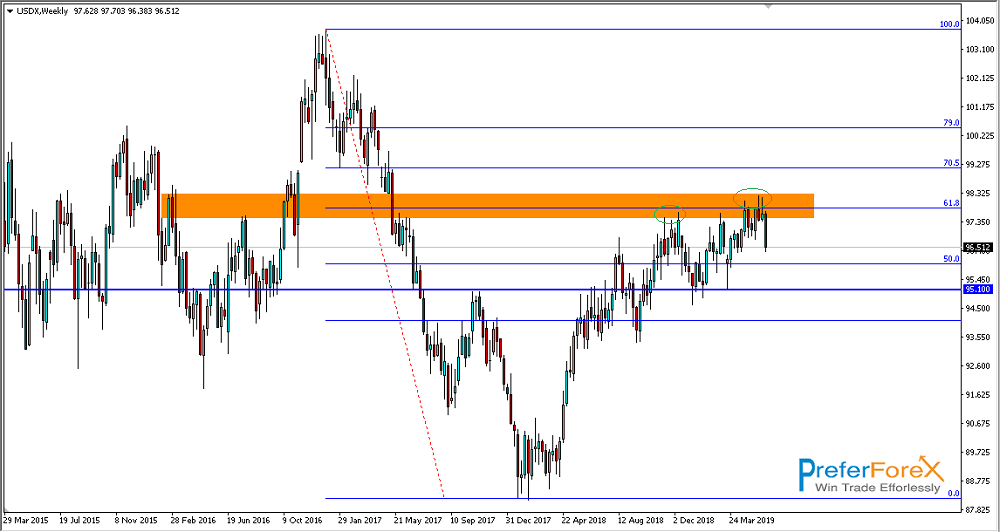
According to the USD index chat, the index is facing a strong supply level supported by Fibonacci 61.8 level. The price tested the area several times but was not able to break the area. Last week we found a strong down movement with the breaking of some little support levels, that is also an indication of upcoming falling of USD index. The nearer support level is 95.10 and now the price is heading towards this support level. After breaking this support the bear will be more strong.