AUDUSD at Critical Confluence: A Bearish Movement Expected
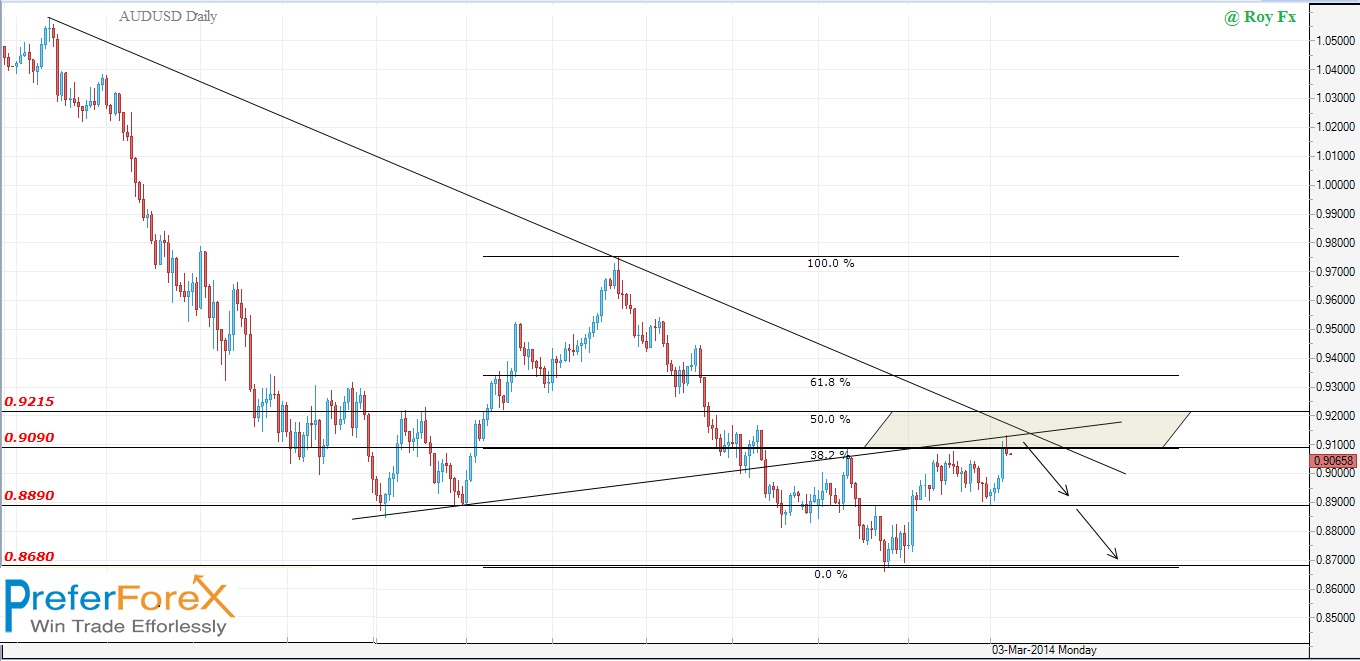
The AUDUSD currency pair is currently at a strong confluence zone near 0.9090. This level is significant due to in that price two trendline resistances. The Fibonacci 38.2% retracement level, acts as horizontal resistance. The last daily candle has formed a rejection pattern. A bearish movement is expected from this area targeting 0.8890 followed by 0.8680. However, a break and close above the 50% Fibonacci level would invalidate this bearish scenario.
Key Levels to Watch
1. Resistance at 0.9090: This level is reinforced by two converging trendlines and the 38.2% Fibonacci retracement, making it a formidable resistance point. The rejection candle at this level indicates strong selling pressure.
2. Support at 0.8890 and 0.8680: These levels are the immediate bearish targets if the resistance at 0.9090 holds. They represent significant support zones where price action may pause or reverse.
3. 50% Fibonacci Level: A break and close above this level would invalidate the bearish outlook and could signal a shift in momentum towards a more bullish stance.

Technical Outlook
The AUDUSD is at a pivotal point, with the following technical factors influencing its movement:
– Daily Chart: The formation of a rejection candle at the confluence of resistances near 0.9090 suggests a potential bearish reversal. The 38.2% Fibonacci retracement level adds weight to this resistance, indicating that sellers are defending this zone aggressively.
– Trendlines: The two descending trendlines converging at 0.9090 further strengthen the resistance, providing additional bearish signals if the price fails to break through.
– Fibonacci Levels: The 38.2% retracement level at 0.9090 is a key horizontal resistance. A break above this level would challenge the 50% Fibonacci retracement, which if breached, could invalidate the bearish outlook.
Want to get exact forex signals? Join here
Conclusion
The AUDUSD is currently testing a strong confluence zone at 0.9090, where two trendline resistances and the 38.2% Fibonacci retracement converge. The recent rejection candle at this level indicates potential for a bearish movement targeting 0.8890, followed by 0.8680. However, traders should watch for a break and close above the 50% Fibonacci level, which would invalidate this bearish scenario and suggest a shift toward bullish momentum.
Get our all trading analysis video on the YouTube channel: https://www.youtube.com/@preferforex_official
