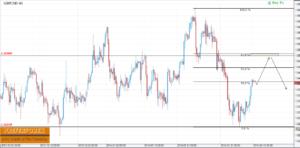
It shows that GBPUSD is in bullish retrenchment from support at 1.6250 after a long bearish movement. In daily chart it has formed a series of rejection candle before a strong bullish candle indicating more bullishness. Now a bullish movement is expected target near 61.8% Fibonacci area at 1.6500. In this area we need to observe price action for further bearish movement. But a break of recent low before reaching 1.6250 can make this scenario invalid.

